Tools & Methods 003 - Innovation Sectors

Sometimes we use existing tools, sometimes we create tools and sometimes we modify tools. In this case I will be talking about the latter.

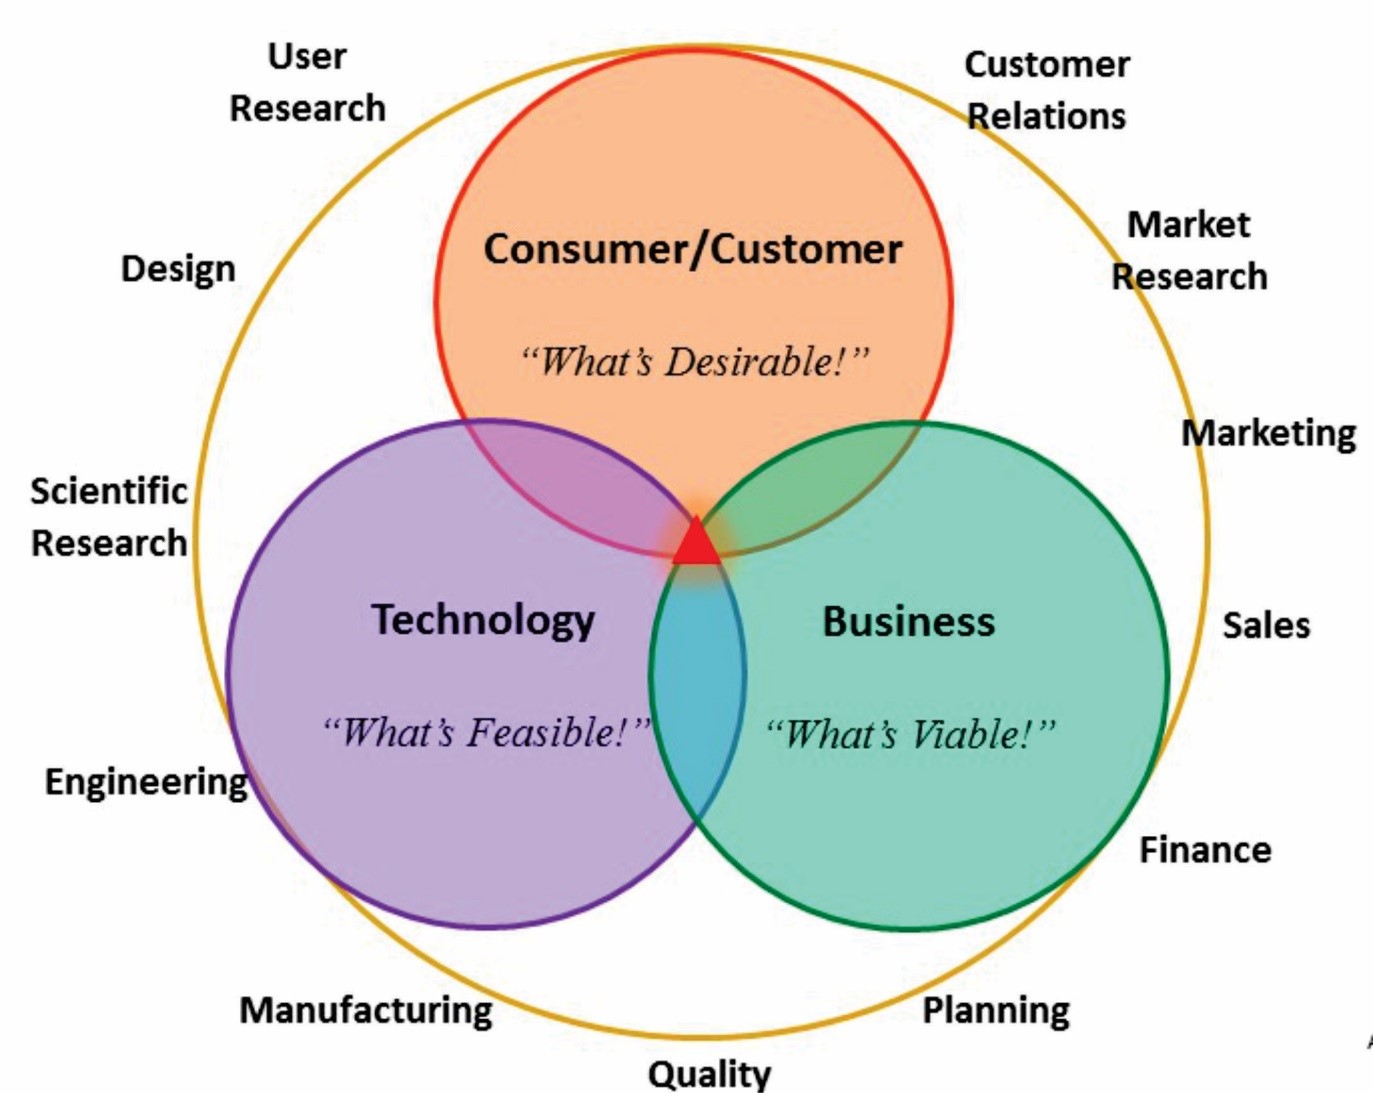
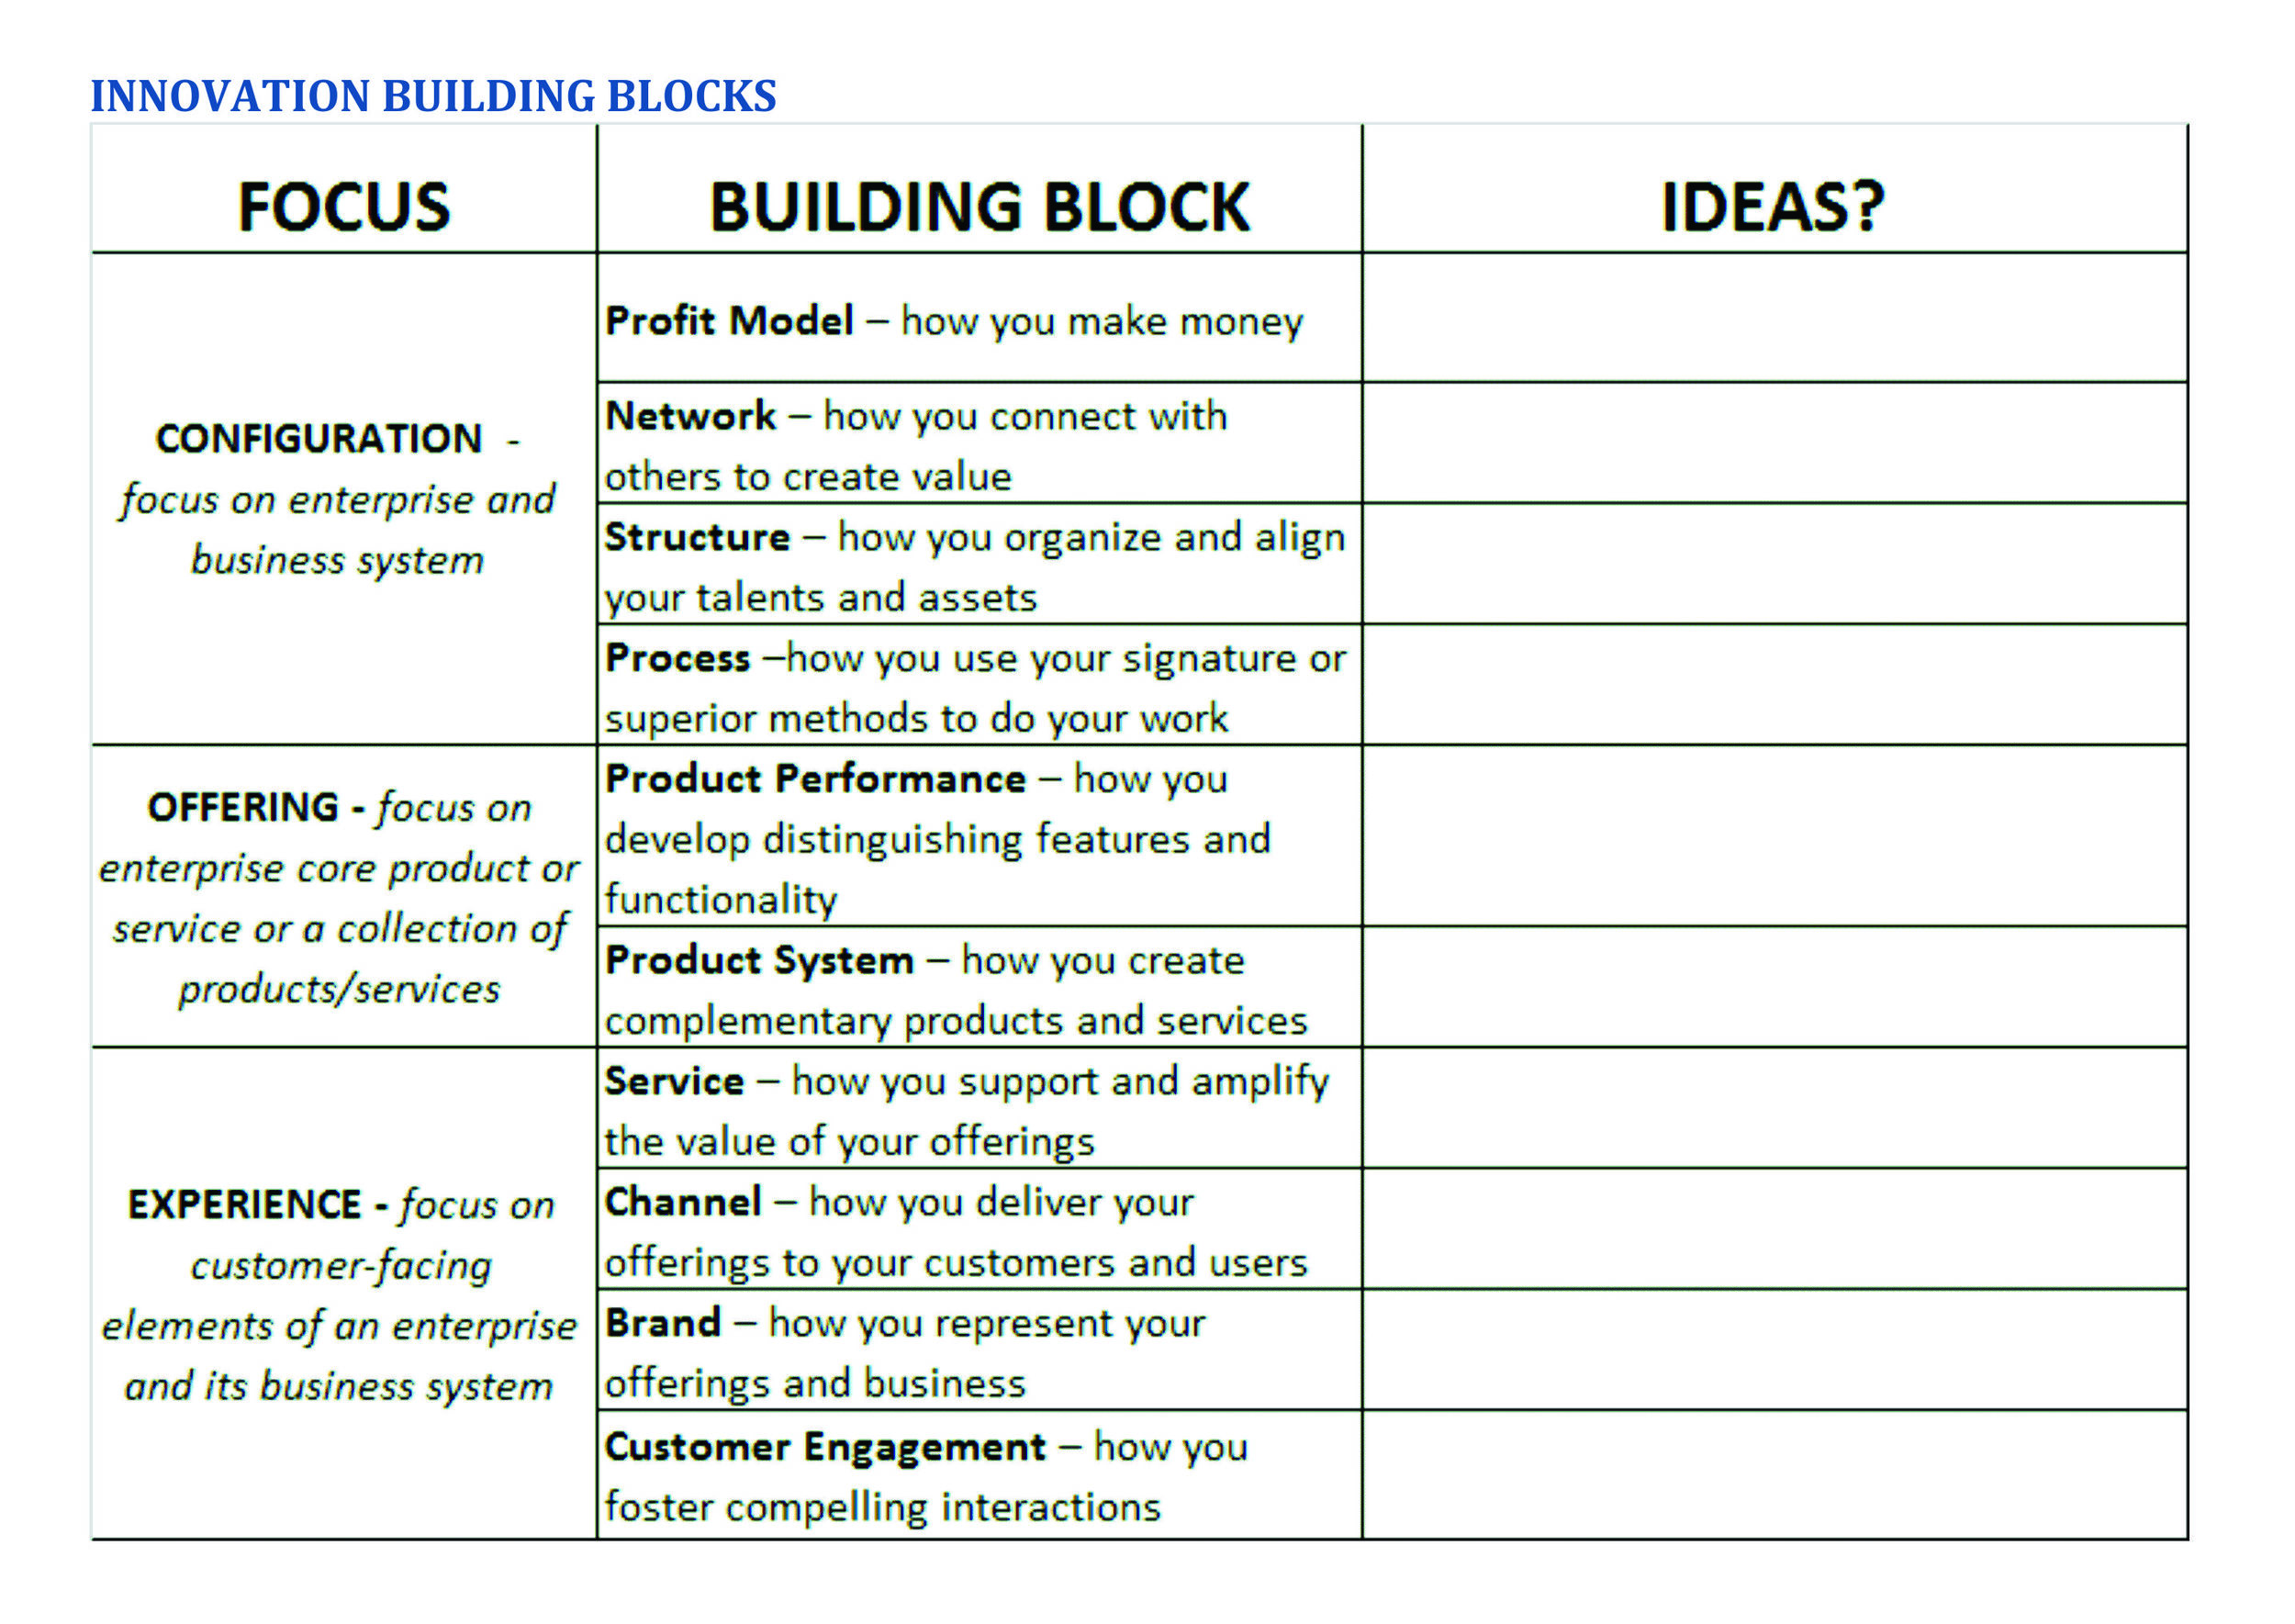
A few months ago I was working with Mike Hruska of Problem Solutions http://www.problemsolutions.net to design a new division of a B2B software company. I had a few of my own tools but Mike asked me to include a tool he had been developing called Innovation Building Blocks. This tool is based on the seminal work Ten Types of Innovation http://www.amazon.com/Ten-Types-Innovation-Discipline-Breakthroughs/dp/1118504240/ref=sr_1_1?s=books&ie=UTF8&qid=1444668956&sr=1-1&keywords=ten+types+of+innovation by Larry Keeley of the Doblin Group. The goal is to get a company to look at all facets of their company in order to find innovation. I have always liked it because it reduces a company’s belief that all innovation comes from technology.

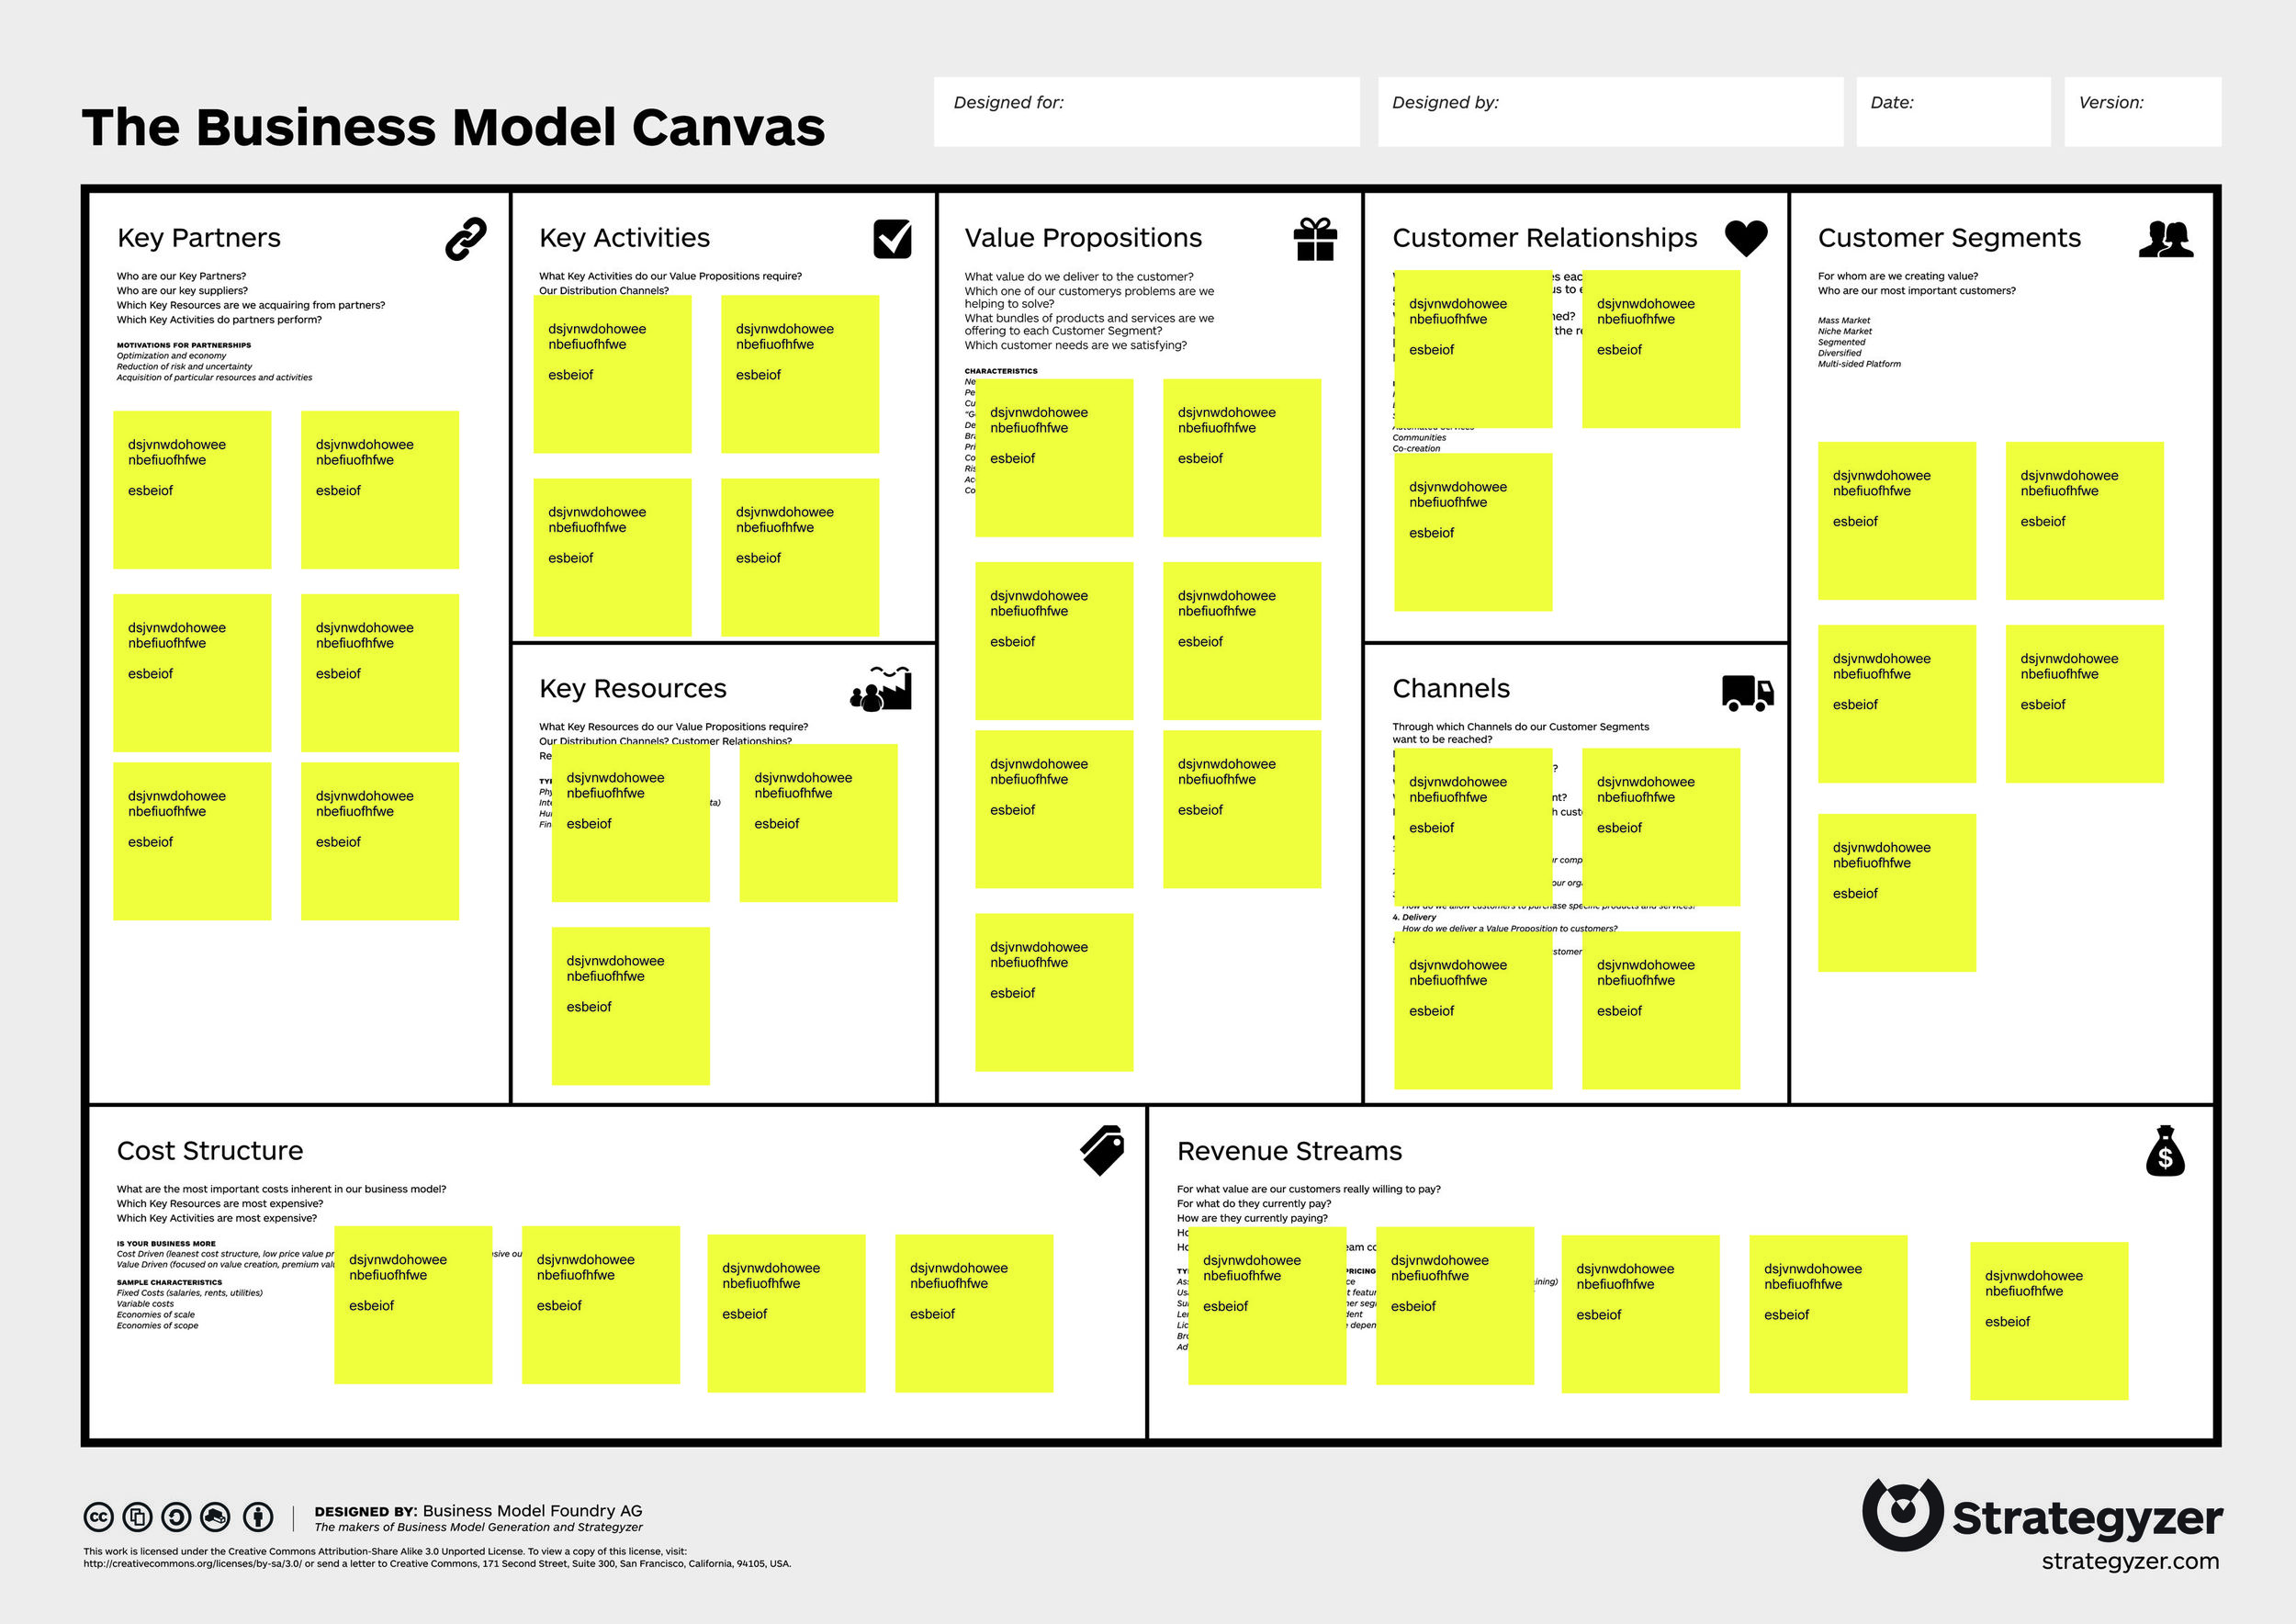
From the book, Mike had developed the below poster:

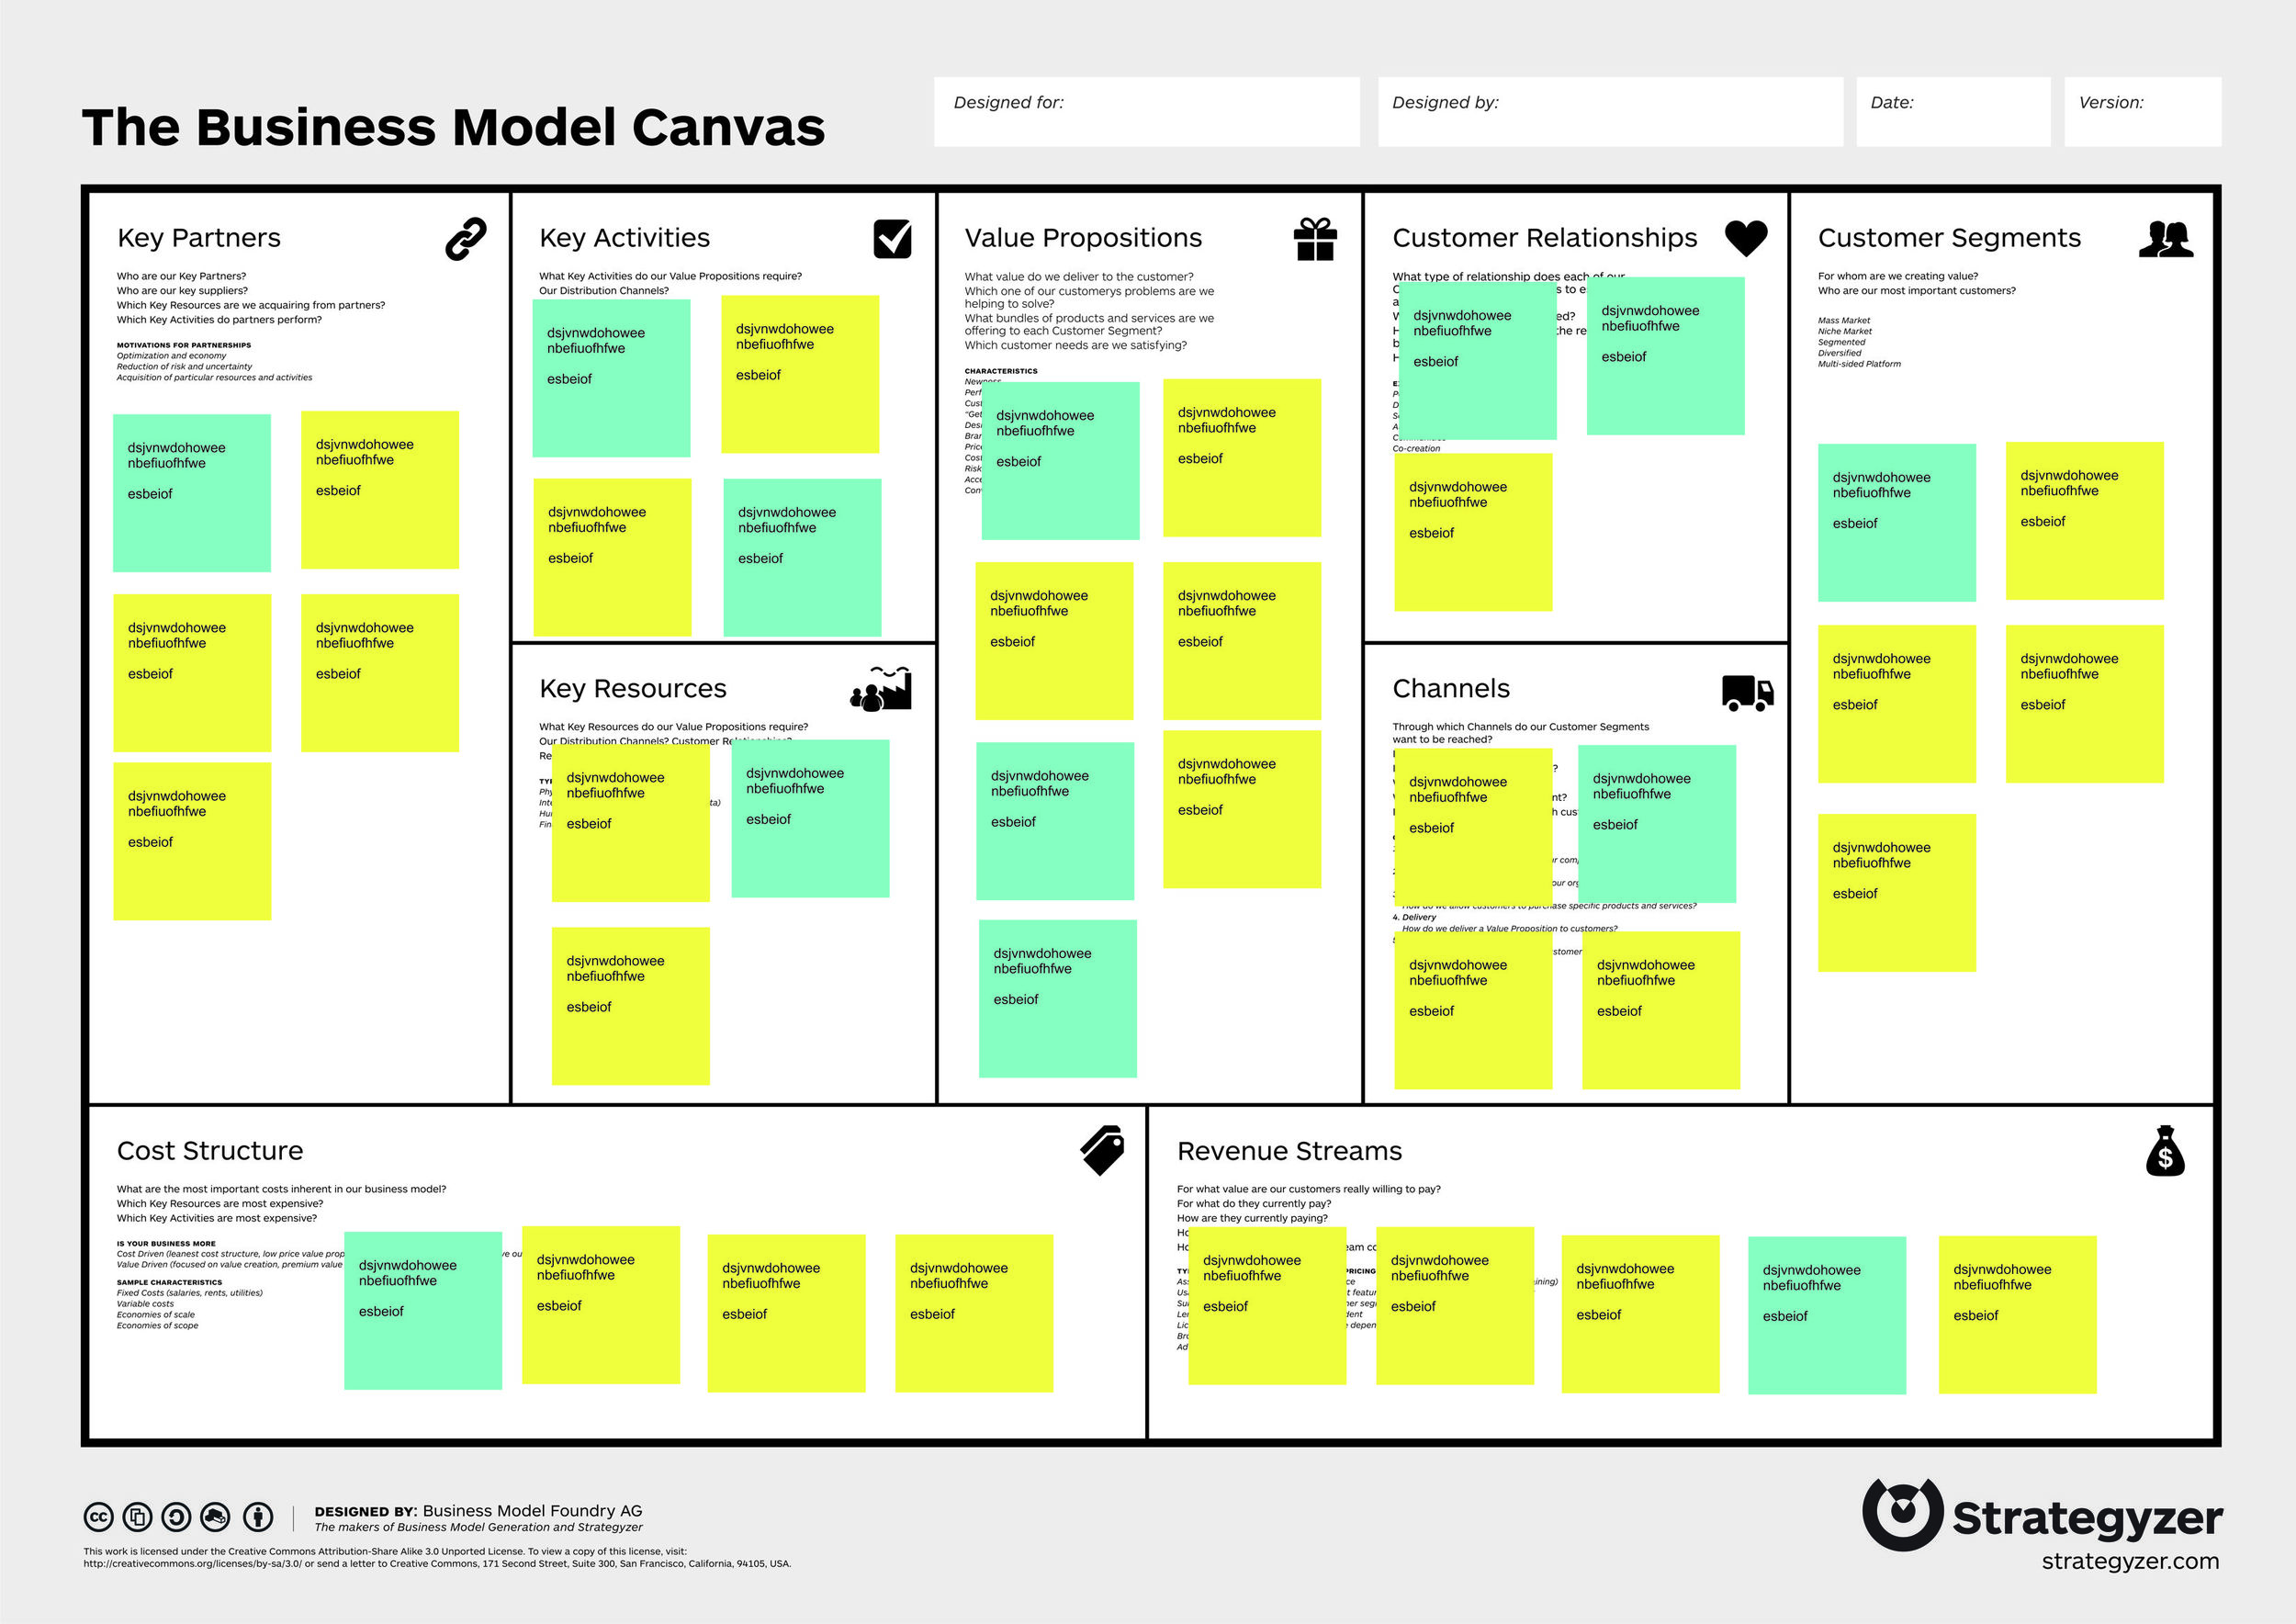
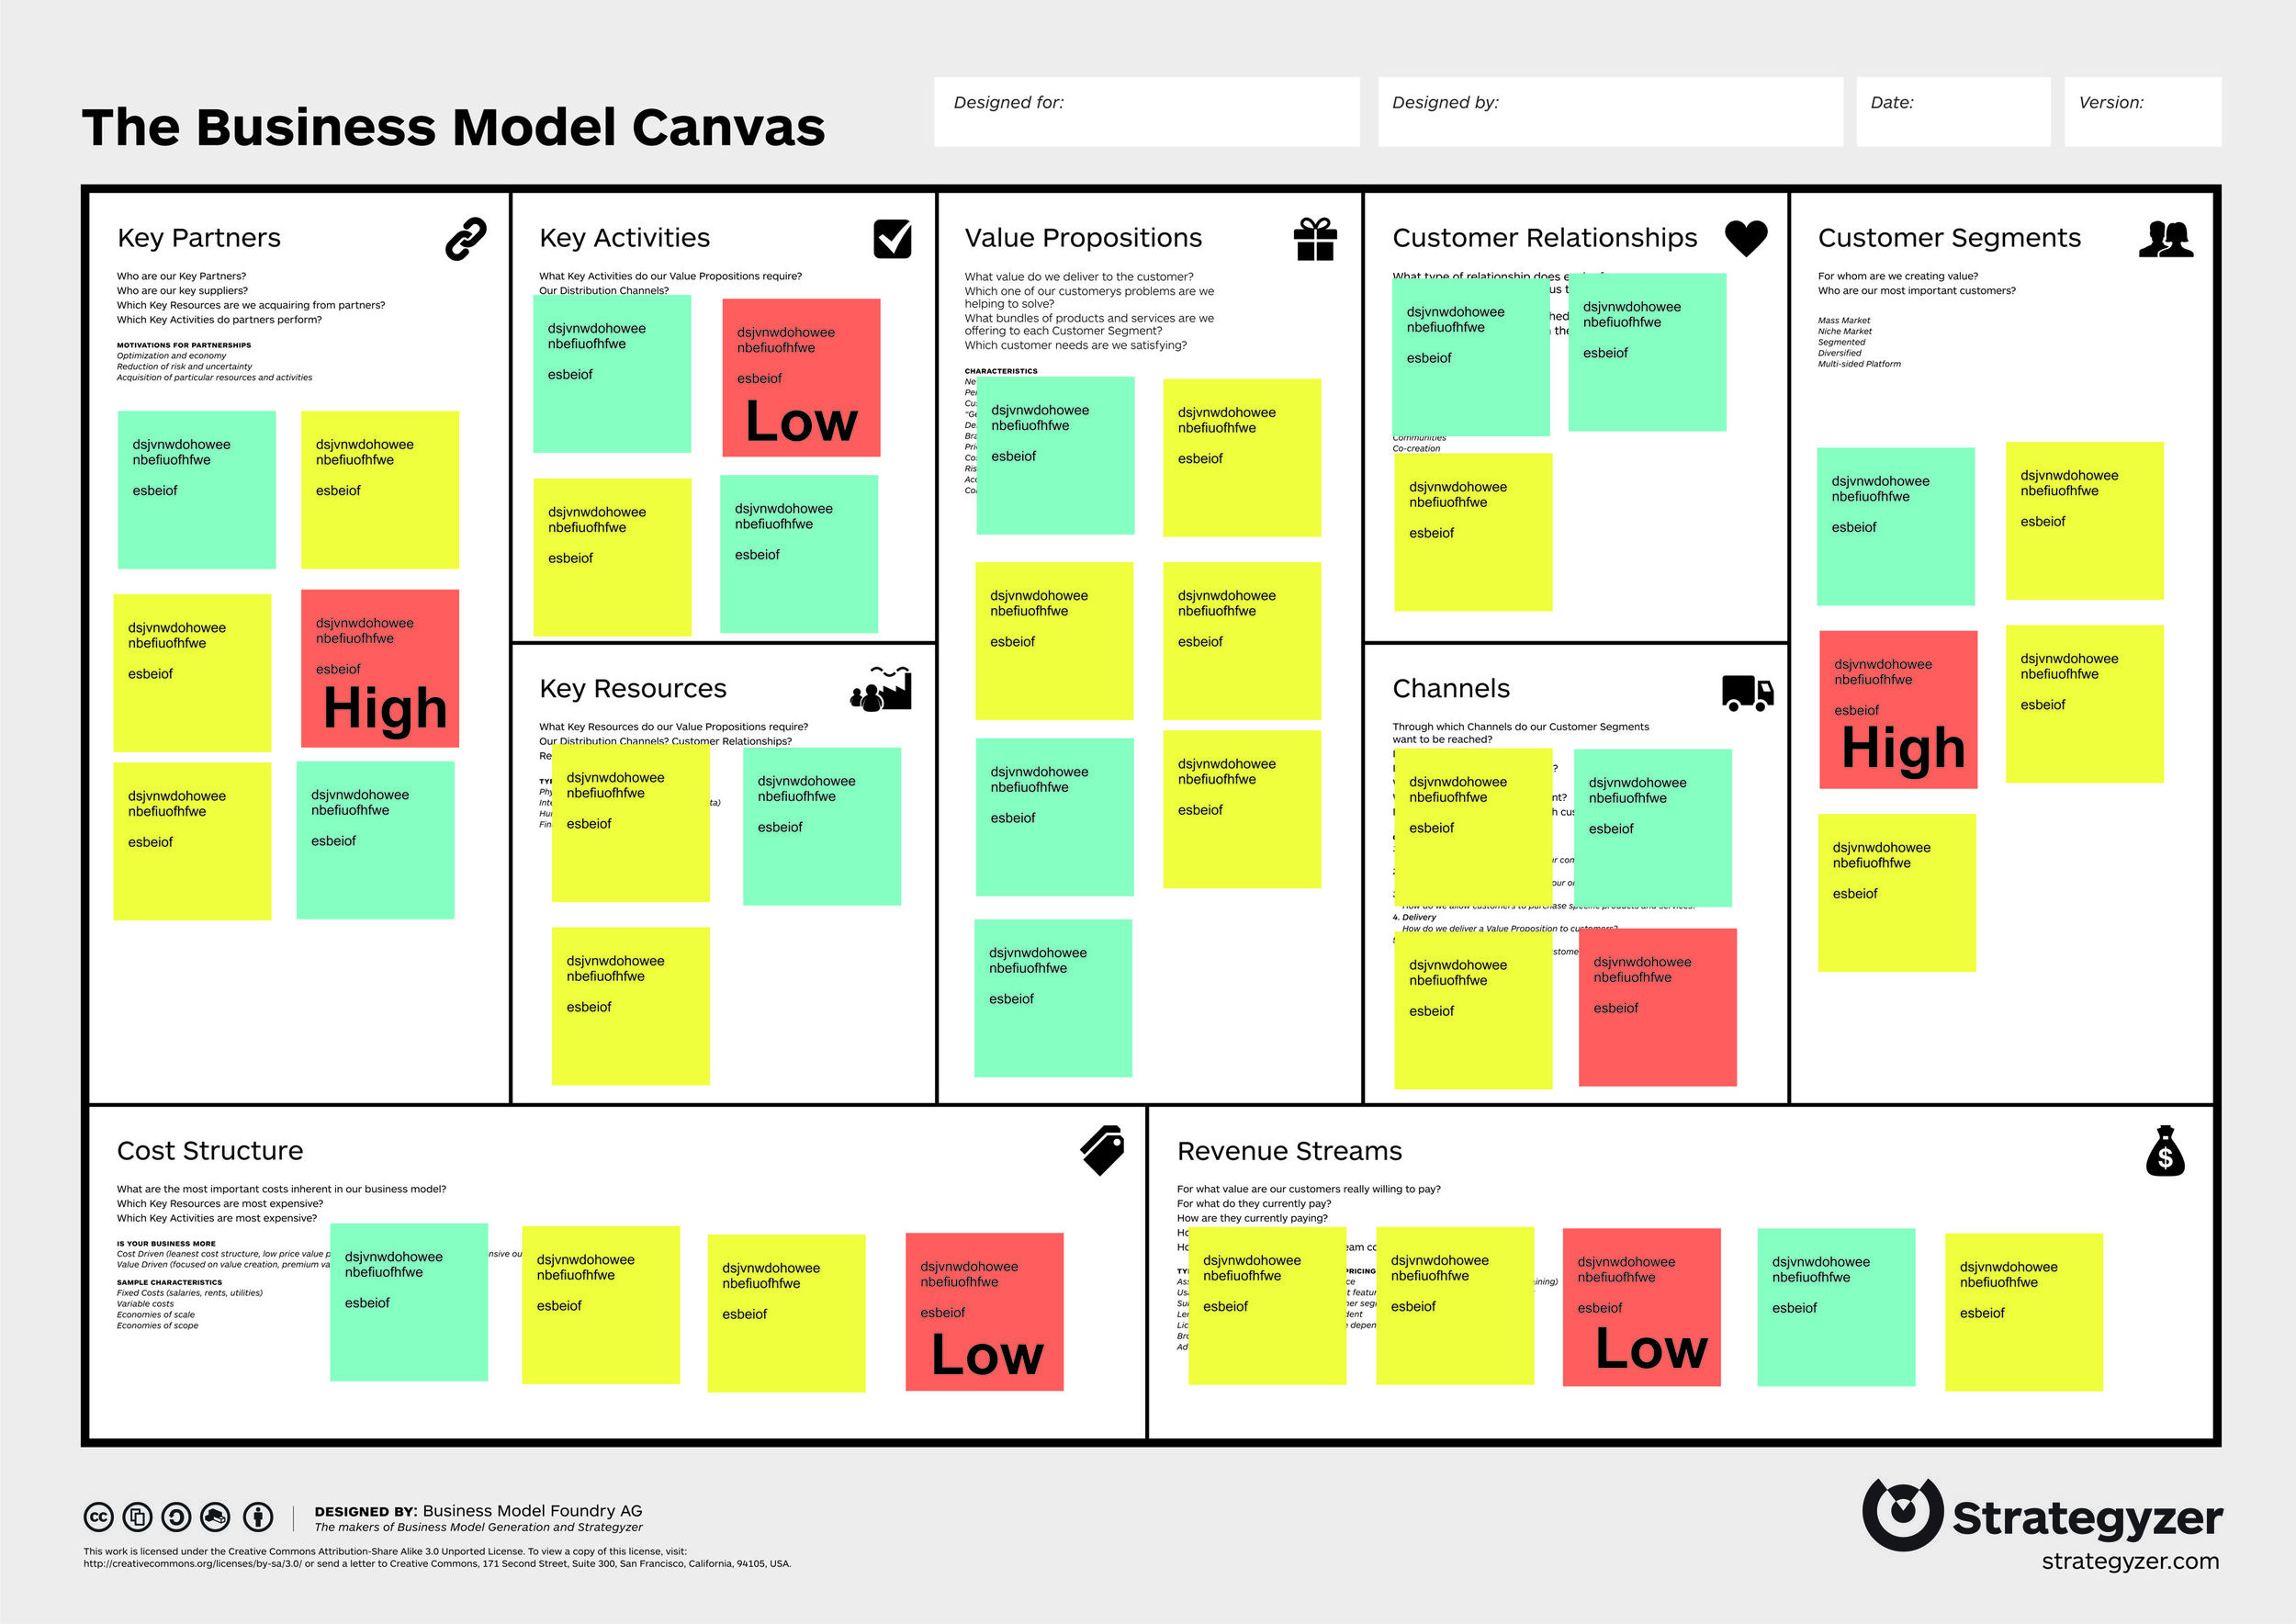
In the act of using this tool I found that the participants were having a hard time dealing with what they do in the present versus what they might do in the future. I have always found designers can move between the present and past quite easily but it seemed that this was not the case for everyone. There needed to be a way for participants to better organize what they do and what they might be able to do in separate buckets. Based on working with this tool I propose the below:

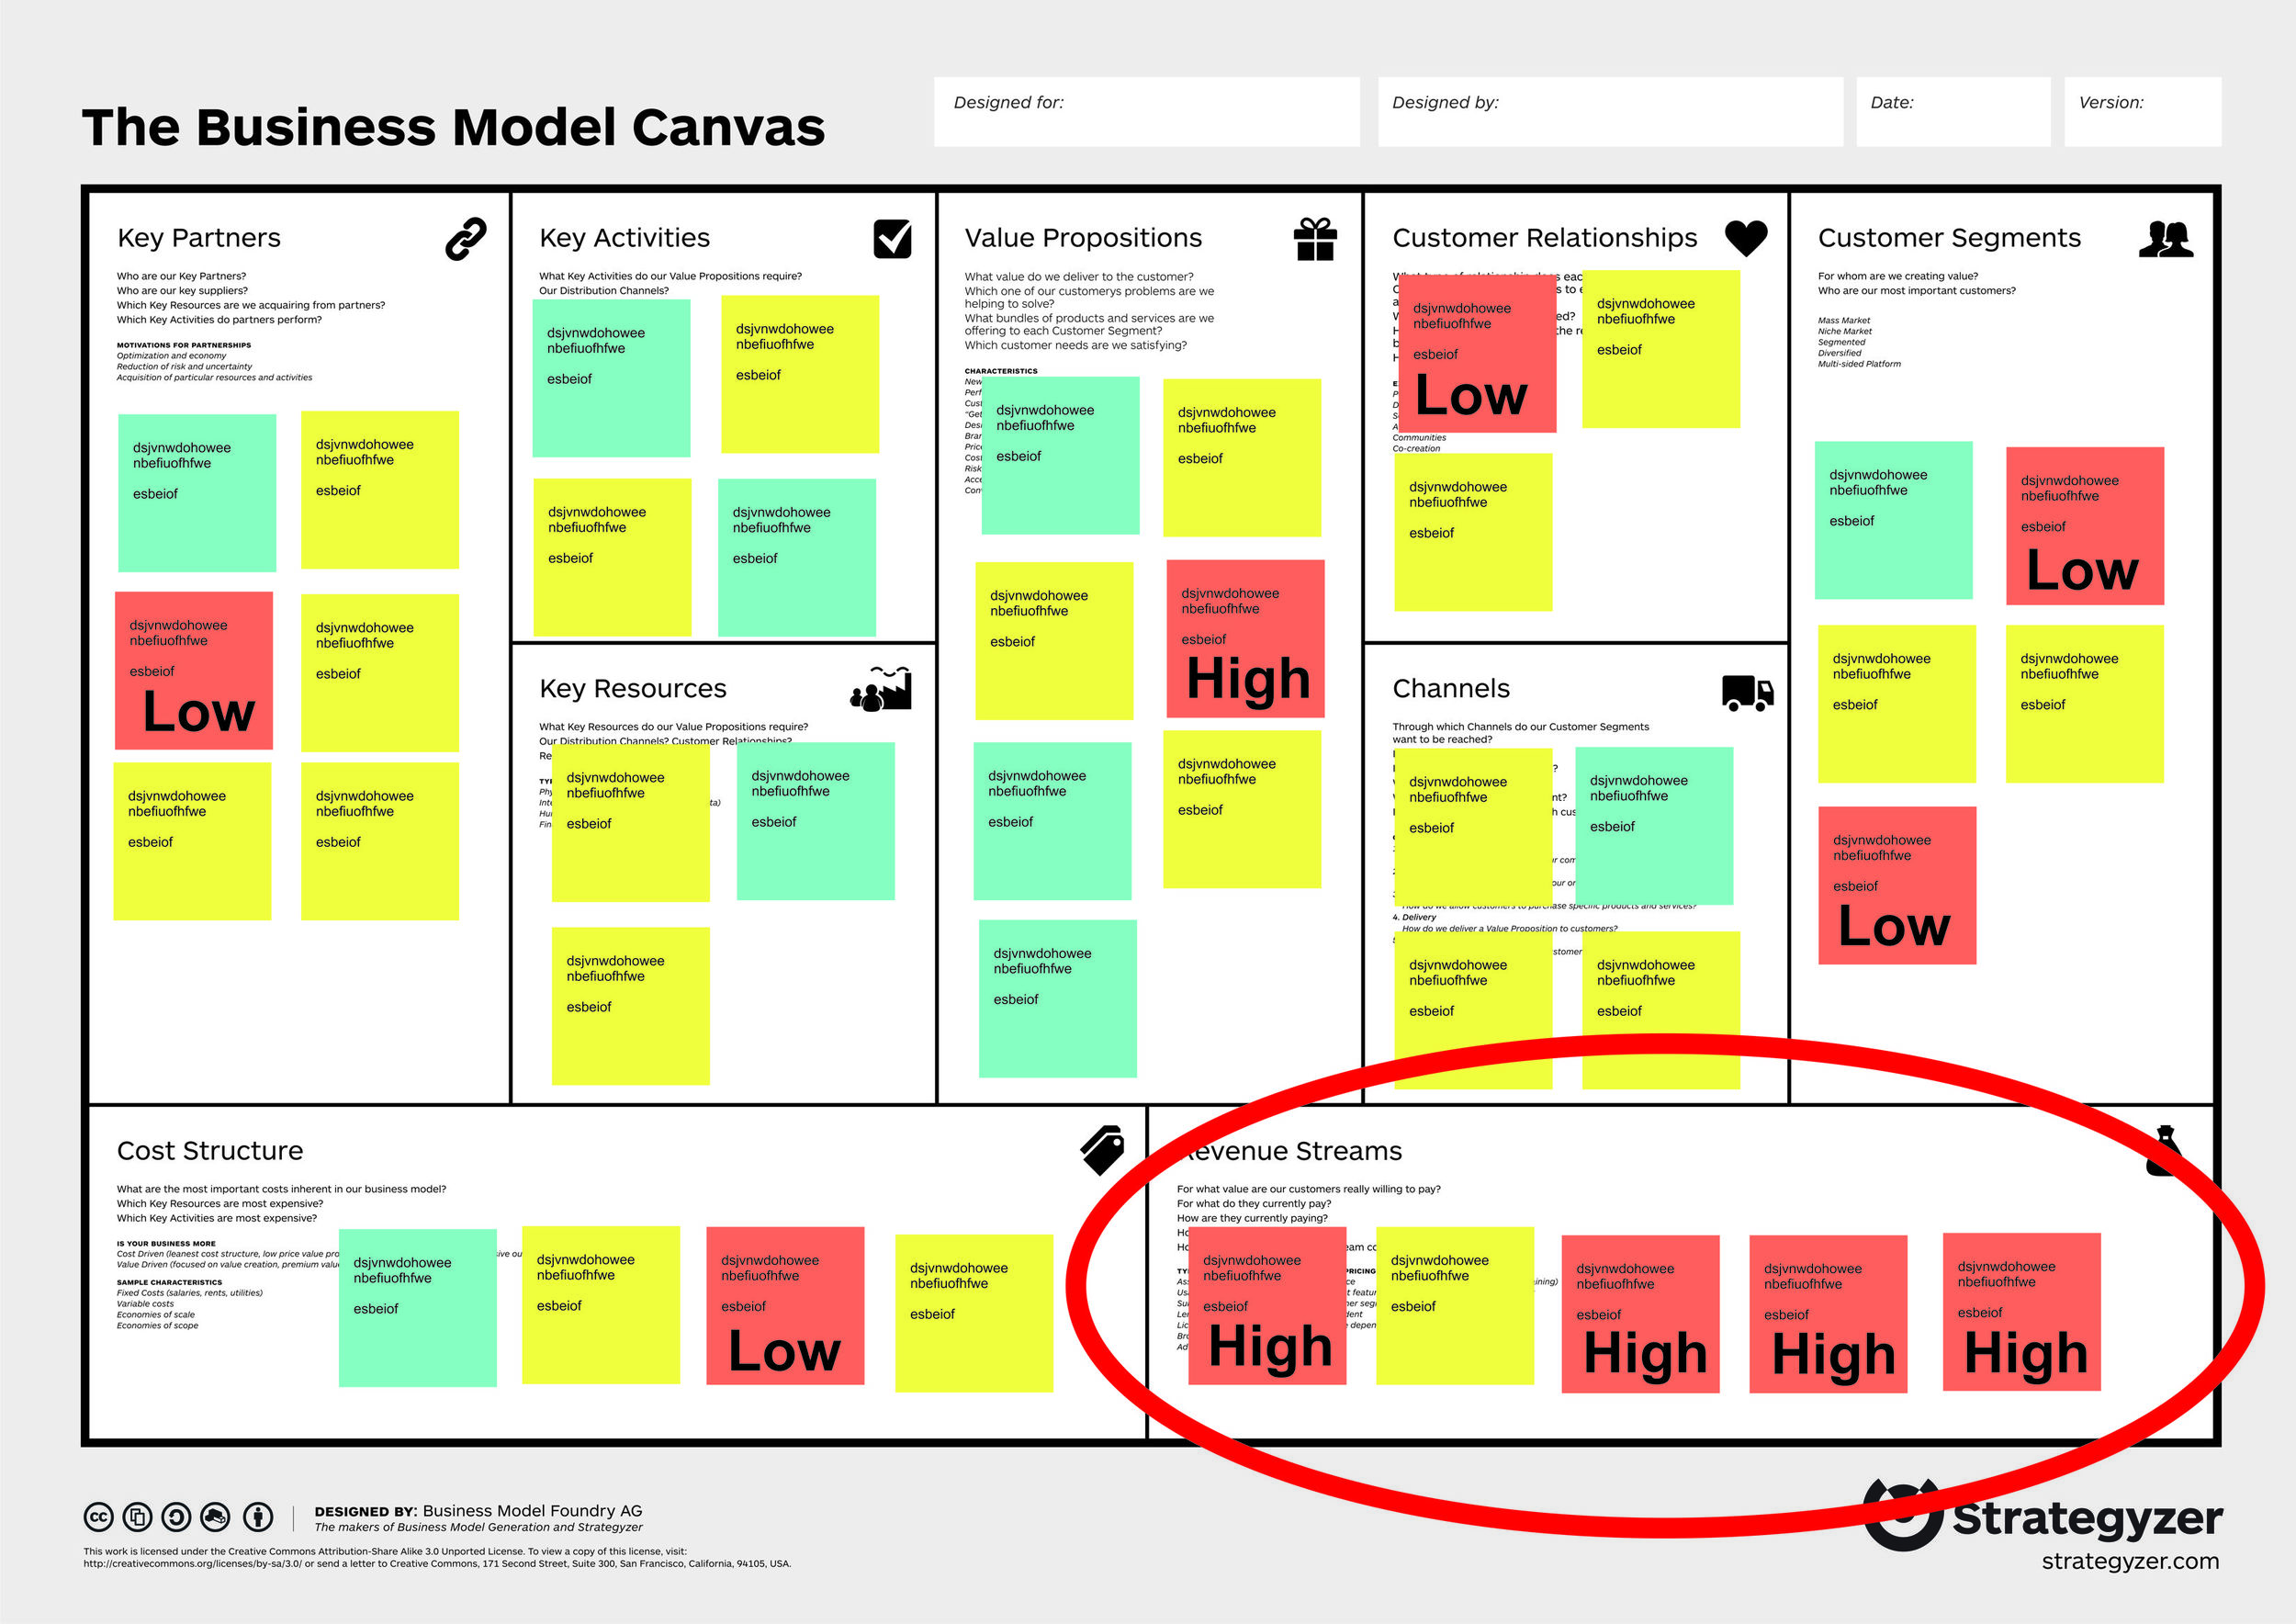
As you can see, the present situation has its own section as well as what could be. In a typical workshop the poster would look like the below:

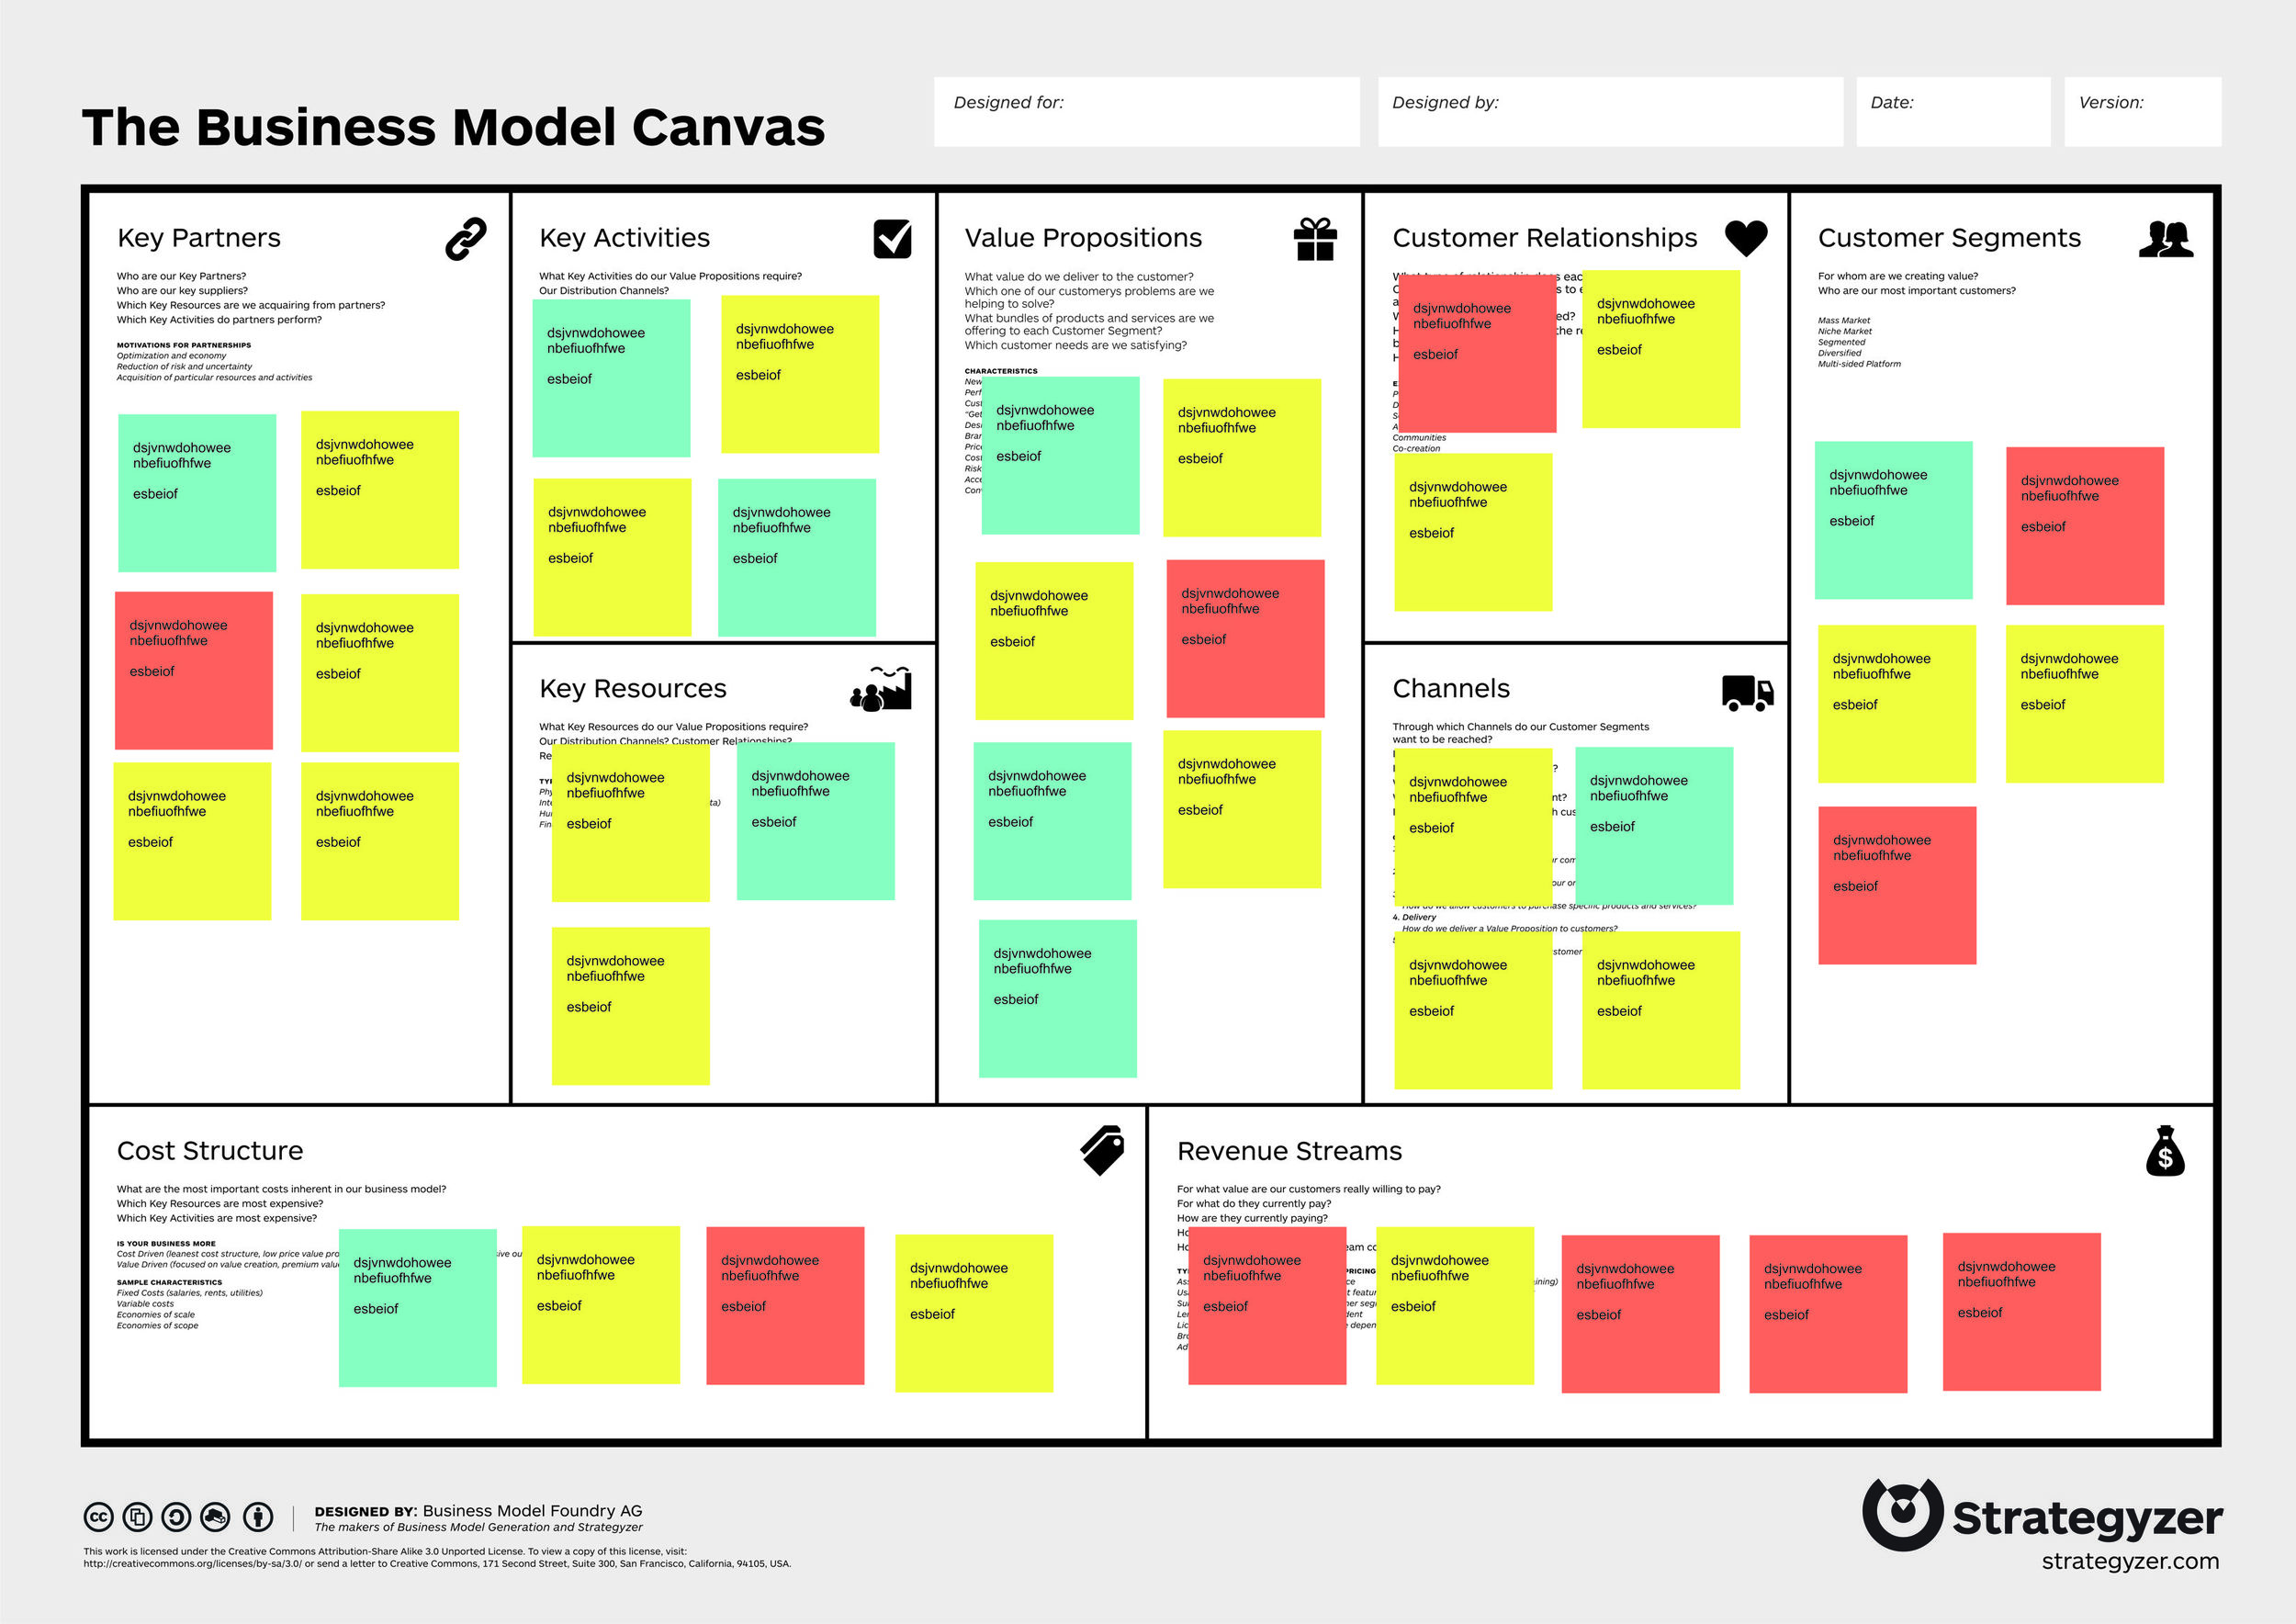
I also realized there needed to be a way of bringing the present and future together. There needed to be an easy way to document what would be kept and what would be changed. So as you saw from the previous image I use two different colors of post it notes, blue for the current situation and yellow for what could be. These then move to the final column entitles “What will be”.  A completed poster is below:

I thank Mike for introducing me to his tool and hope he and others find the modifications useful in organizing a comprehensive business design.

Tools & Methods 002: Value Sorting

As discussed in the previous Tools & Methods post, brainstorming drove me crazy in the 1990s because the results were never converged back down to actionable strategies. Over the years I have learned to use multiple tools to translate ideas into comprehensive strategies that the client can implement to succeed.

Patrick Whitney, Dean of the IIT Institute of Design, explains that the Sweet Spot of Innovation comes at the intersection of what is Desirable (valued benefits), Possible (technology capability) and Viable (sustainable profits). Below is a modified diagram, where some of the words have been changed but the meaning is the same:

Based on the above three requirements, I developed the Value Sorting Tool, which is a convergence tool to ensure valuable strategies have been created. While I do spend a lot of time with my clients in divergence exercises, I find that convergence is really the most exciting area. Below is an example of my convergence tool, called Value Sorting, which includes the addition of Protectability (legal protection from competition):

After the divergence exercise has been completed, I proceed with Affinity Mapping in order to create multi-layered strategies. This is followed by the use of the Value Sorting Tool. The participants rate each of the four value requirements on a 1-10 scale. I also provide the participants a cheat sheet giving examples of a 1, 5 and 10 value level for each requirement. I also give them a separate cheat sheet after the rating has occurred in order to organize the results. The two “no-brainers” are if all four requirements have high scores (do it) and if the all have low scores (throw away). The interesting part is when most scores are high but one is low. Then there must be a decision whether to develop a Minimum Viable Project in order to see if the low score can be raised. More on the Minimum Viable Project in future blogposts.

It is very important to have people from different areas of the business in the room during this exercise. I have often found that people typically rate the requirement that affects their area as higher than requirements that affect another person’s area. Having them create value together will guarantee a lively discussion.

Download the Value Sorting template Please read the Creative Commons requirements.

© 2015 One BusinessDesign, LLC

Tools and Methods 001: Visual Risk Assessment for Business Model Canvas

Since 2008, the Business Model Canvas (BMC), developed by Alexander Osterwalder, has been an easily accessible tool to help visualize the complexity of a business model on one sheet of paper. This tool works well for both startup companies as well as large corporations who are developing an offering that requires a new and/or different business model from what they have used in the past.

Below is an example of the BMC template:

After completing, the BMC process to both catalog what you know as well as iterate what might be possible to do, the results would typically look like this:

How do you use this one page visualization of your business model to recognize what are the most important areas to concentrate on? I use a technique I have termed Visual Risk Assessment.

Steps of the Visual Risk Assessment method:

1) Completion

Once the BMC has been built, I return to each item and ask the following question:

Is this item completed?

If the answer is yes, I change the post-it color, in this case to blue. By doing this, we can see what is completed and what still needs to be done, as seen below:

2) Control

The next step would be to review the items that still need to be completed and ask the following question:

Do you control this item or does it require a third person to agree in order for it to happen?

If the answer is “we control it”, the post-it note remains its original color. If the answer is “a third party must agree in order for this to happen”, I change the post-it to a different color. Control can often seem subjective. Having different people from different departments in the room generates different perspectives but a more realistic view of the complexity of “control”. The BMC appears as follows:

3) Risk Level

The next step is to determine if the third party control is high risk or low risk and mark the post it accordingly. In many cases, a person from one department will think something is low risk but someone from another department will be able to articulate a valid reason why it is high risk, and vice versa. Sometimes this is the first time that different groups within the company have looked at issues together.

Here is an example of where a company has a real problem with risk in their business model:

In this case, there is a very high risk in the Revenue Streams area. Not only is most of it out of the company’s control but each item is a high risk. This company would need to immediately focus on revenue streams in order to either lower the risk or find new revenue streams that are less risky. The BMC would appear as follows:

Now the company has not only a visualization of their business model but an understanding of what needs to be prioritized and what risks needs to be mitigated.

In conclusion, I have worked with the BMC on many occasions. When I first worked with the BMC, I had a sense of déjà vu from my early days of using brainstorming in the mid-1990s. During that era, a brainstorming session would end with a room full of post-it notes but there was never an exercise to translate all these ideas down to actionable solutions. Since that time, we have developed tools to converge all these ideas back down to something useful (you will see one new tool in my next Tools & Methods blog post).


© 2015 One BusinessDesign, LLC