Observation 004 - Misunderstood Failure and the Oort Cloud of Possibilities

Recently I have been reading many articles in the business press about Failure as it relates to Design Thinking. In most of these articles there is a complete misunderstanding of how Design Thinking uses failure as a methodology. I would like to correct this misconception and offer a visual representation of the actual process.

Ultimate failure versus incremental failure:

Most articles talk about failure in terms of a lessons learned at the end of a design process and the fact that most organizations do not have the bandwidth nor resources to run many projects at the same time. They cannot fail on multiple projects in order to find the few successes. I do agree that this is true, but the issue is that these articles either see failure as the ultimate consequence of a project or see failure as the end point of a project.

This understanding of failure mimics the VC model of investing in multiple startups so that the failure of the majority is compensated by the success of the few. I do have a problem with using this analogy. Design Thinking’s use of failure is an incremental, or course correction, methodology. As I will attempt to explain below, it is a learning tool to lead to the most valuable solution(s).

So what has caused this problem?:

Part of the problem is how we see projects. In the below illustration I have created a representation of traditional project models which are based on a straight line.

Yes, the line works when you know all of the problems at the beginning and need to implement a simple solution, but quickly fails with a Wicked problem or an attempt to create innovative solutions. In the wicked/innovative scenarios, there must be an understanding that a solution comes later, not at the beginning. The above also perpetuates the silo mentality of project development, with different parties in control at different times, instead of seeing projects as an integrated system involving all parties (integrated development).

Design Thinkers, however, have not helped the situation by proposing the below illustration of the design process.

Full disclosure: I have used this illustration in the past and I am not trying to put anyone down for this illustration. The articulation of Design Thinking is relatively new and it takes time and iteration to develop a clear and comprehensive visualization.

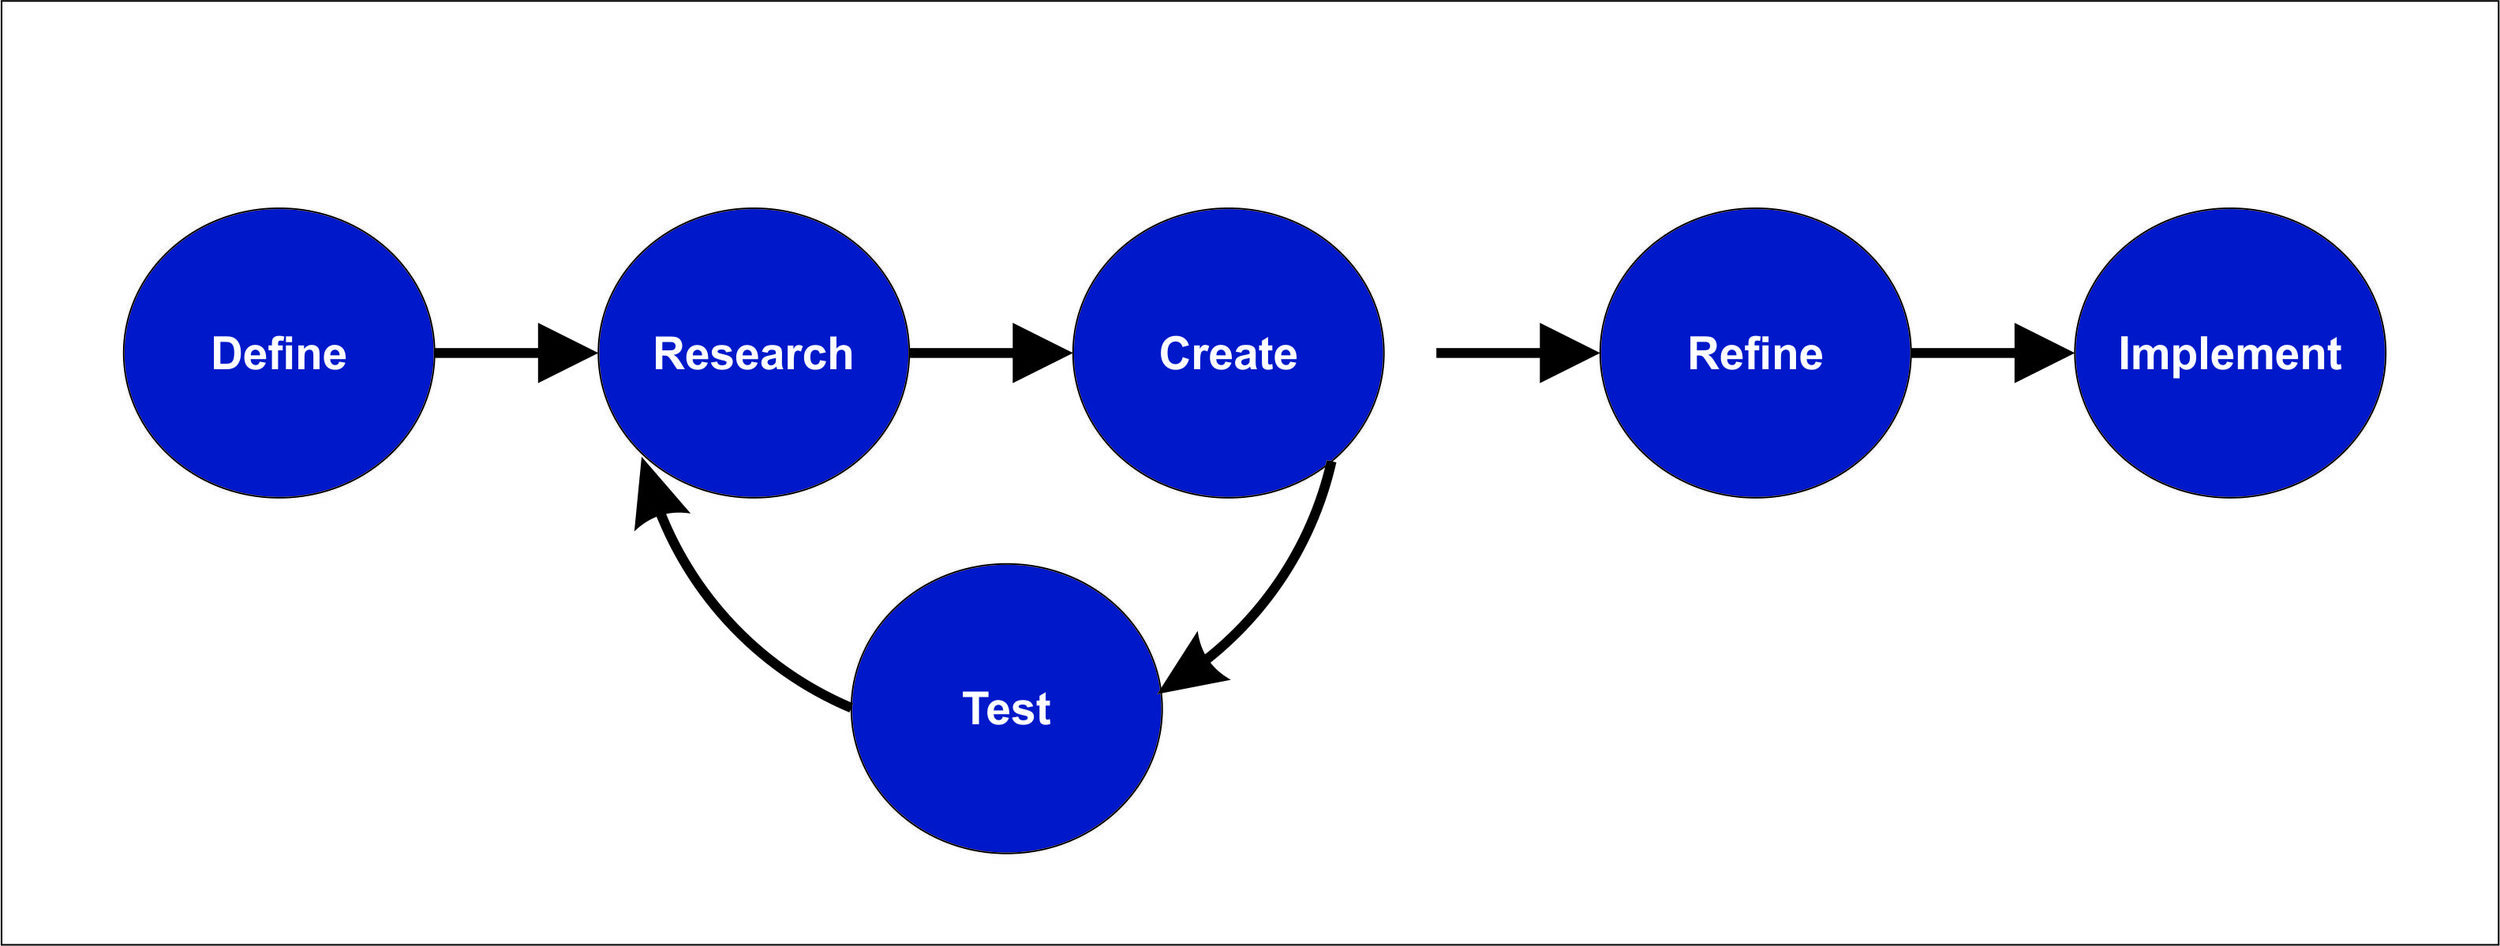
So what is the problem with this illustration? First, because it mimics to linear system, it implies that the spinning back in the test phase could go on forever. Other individuals on the team, who are focused on a project end date, feel very uncomfortable with this illustration. I have to agree.

The second problem is the small divide between Create and Refine. While this is done to attempt to create some clarity that the Research/Create/Test needs to occur several times before moving on.  This gap again creates the belief, by those who are more involved in the latter phases of the project, that they must wait for the spinning to stop, the magic moment, before they can plan to become involved.

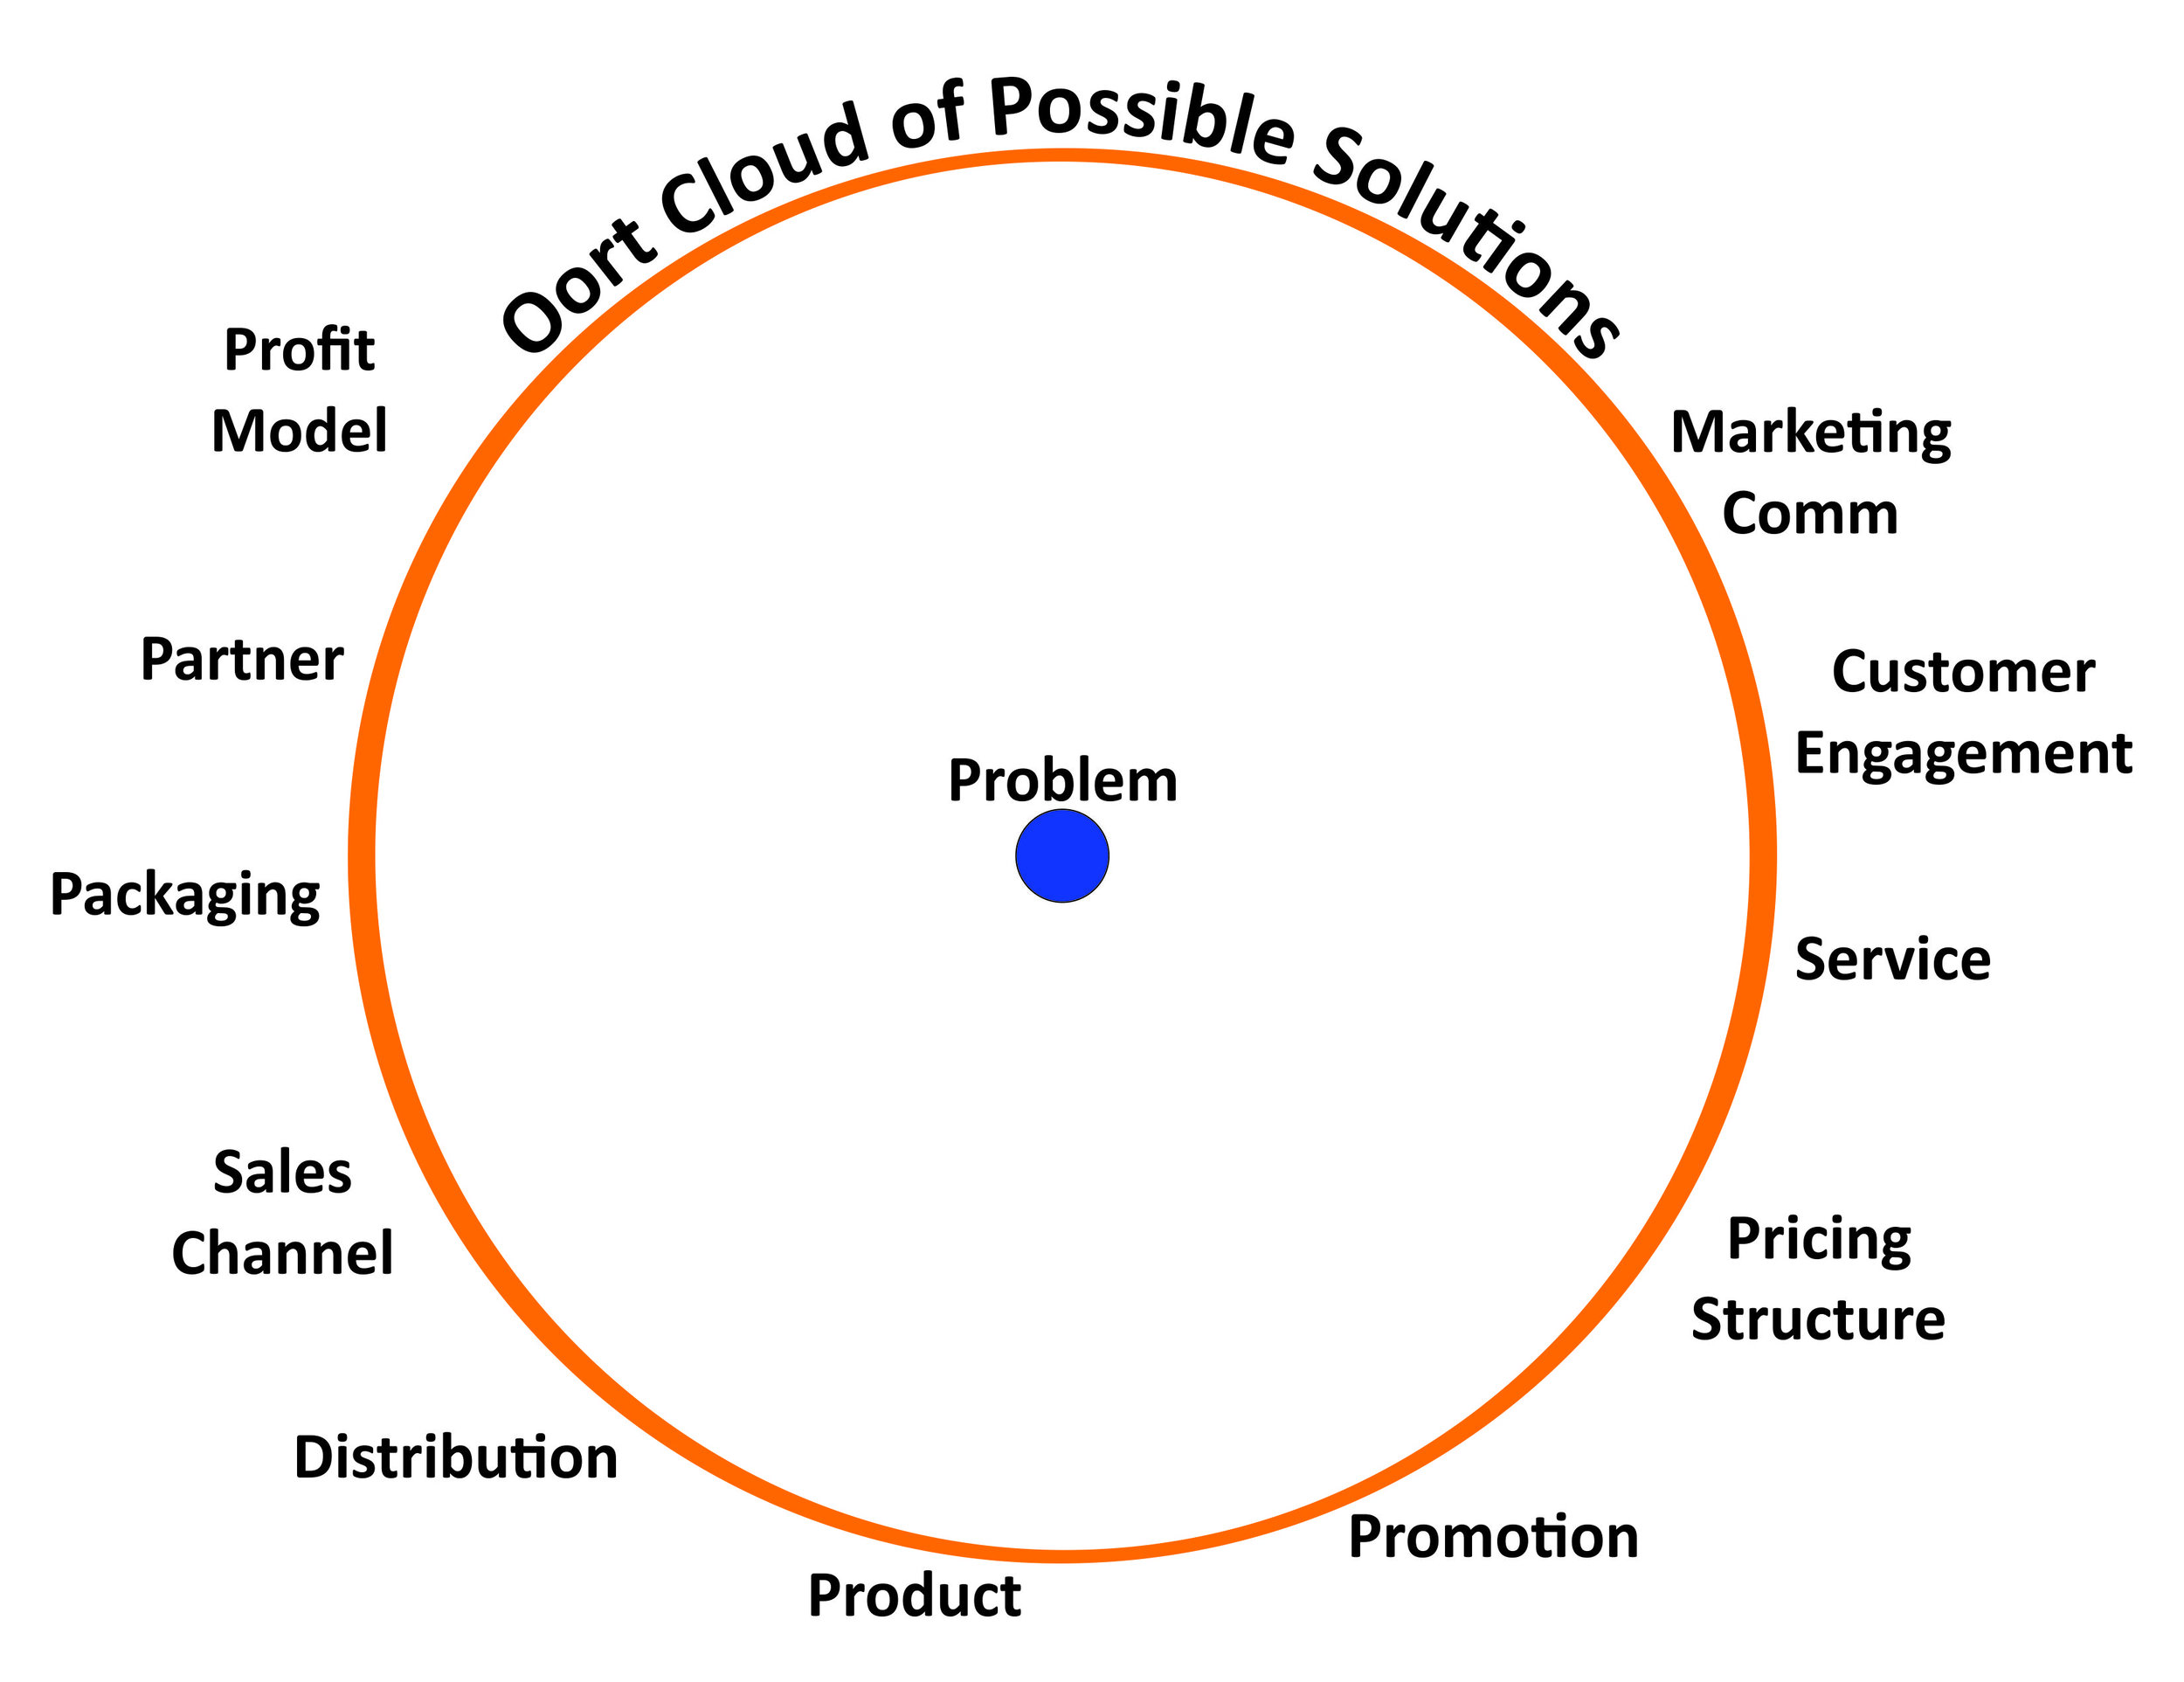
One Solution – The Oort Cloud Visual:

Background - The Oort Cloud, named after Dutch astronomer Jan Oort and Estonian astronomer Ernst Öpika, is theoretical region of the solar system, far beyond the orbit of the dwarf planet Pluto, in which billions of comets move in nearly circular orbits.

With Wicked Problems, we know there is a problem to be solved. However, the problem is difficult or impossible to solve because of incomplete, contradictory, and changing requirements that are often difficult to recognize. As such, the Oort cloud is a great analogy with which to start.


We know the answer is out there, but we don’t know exactly where to go.


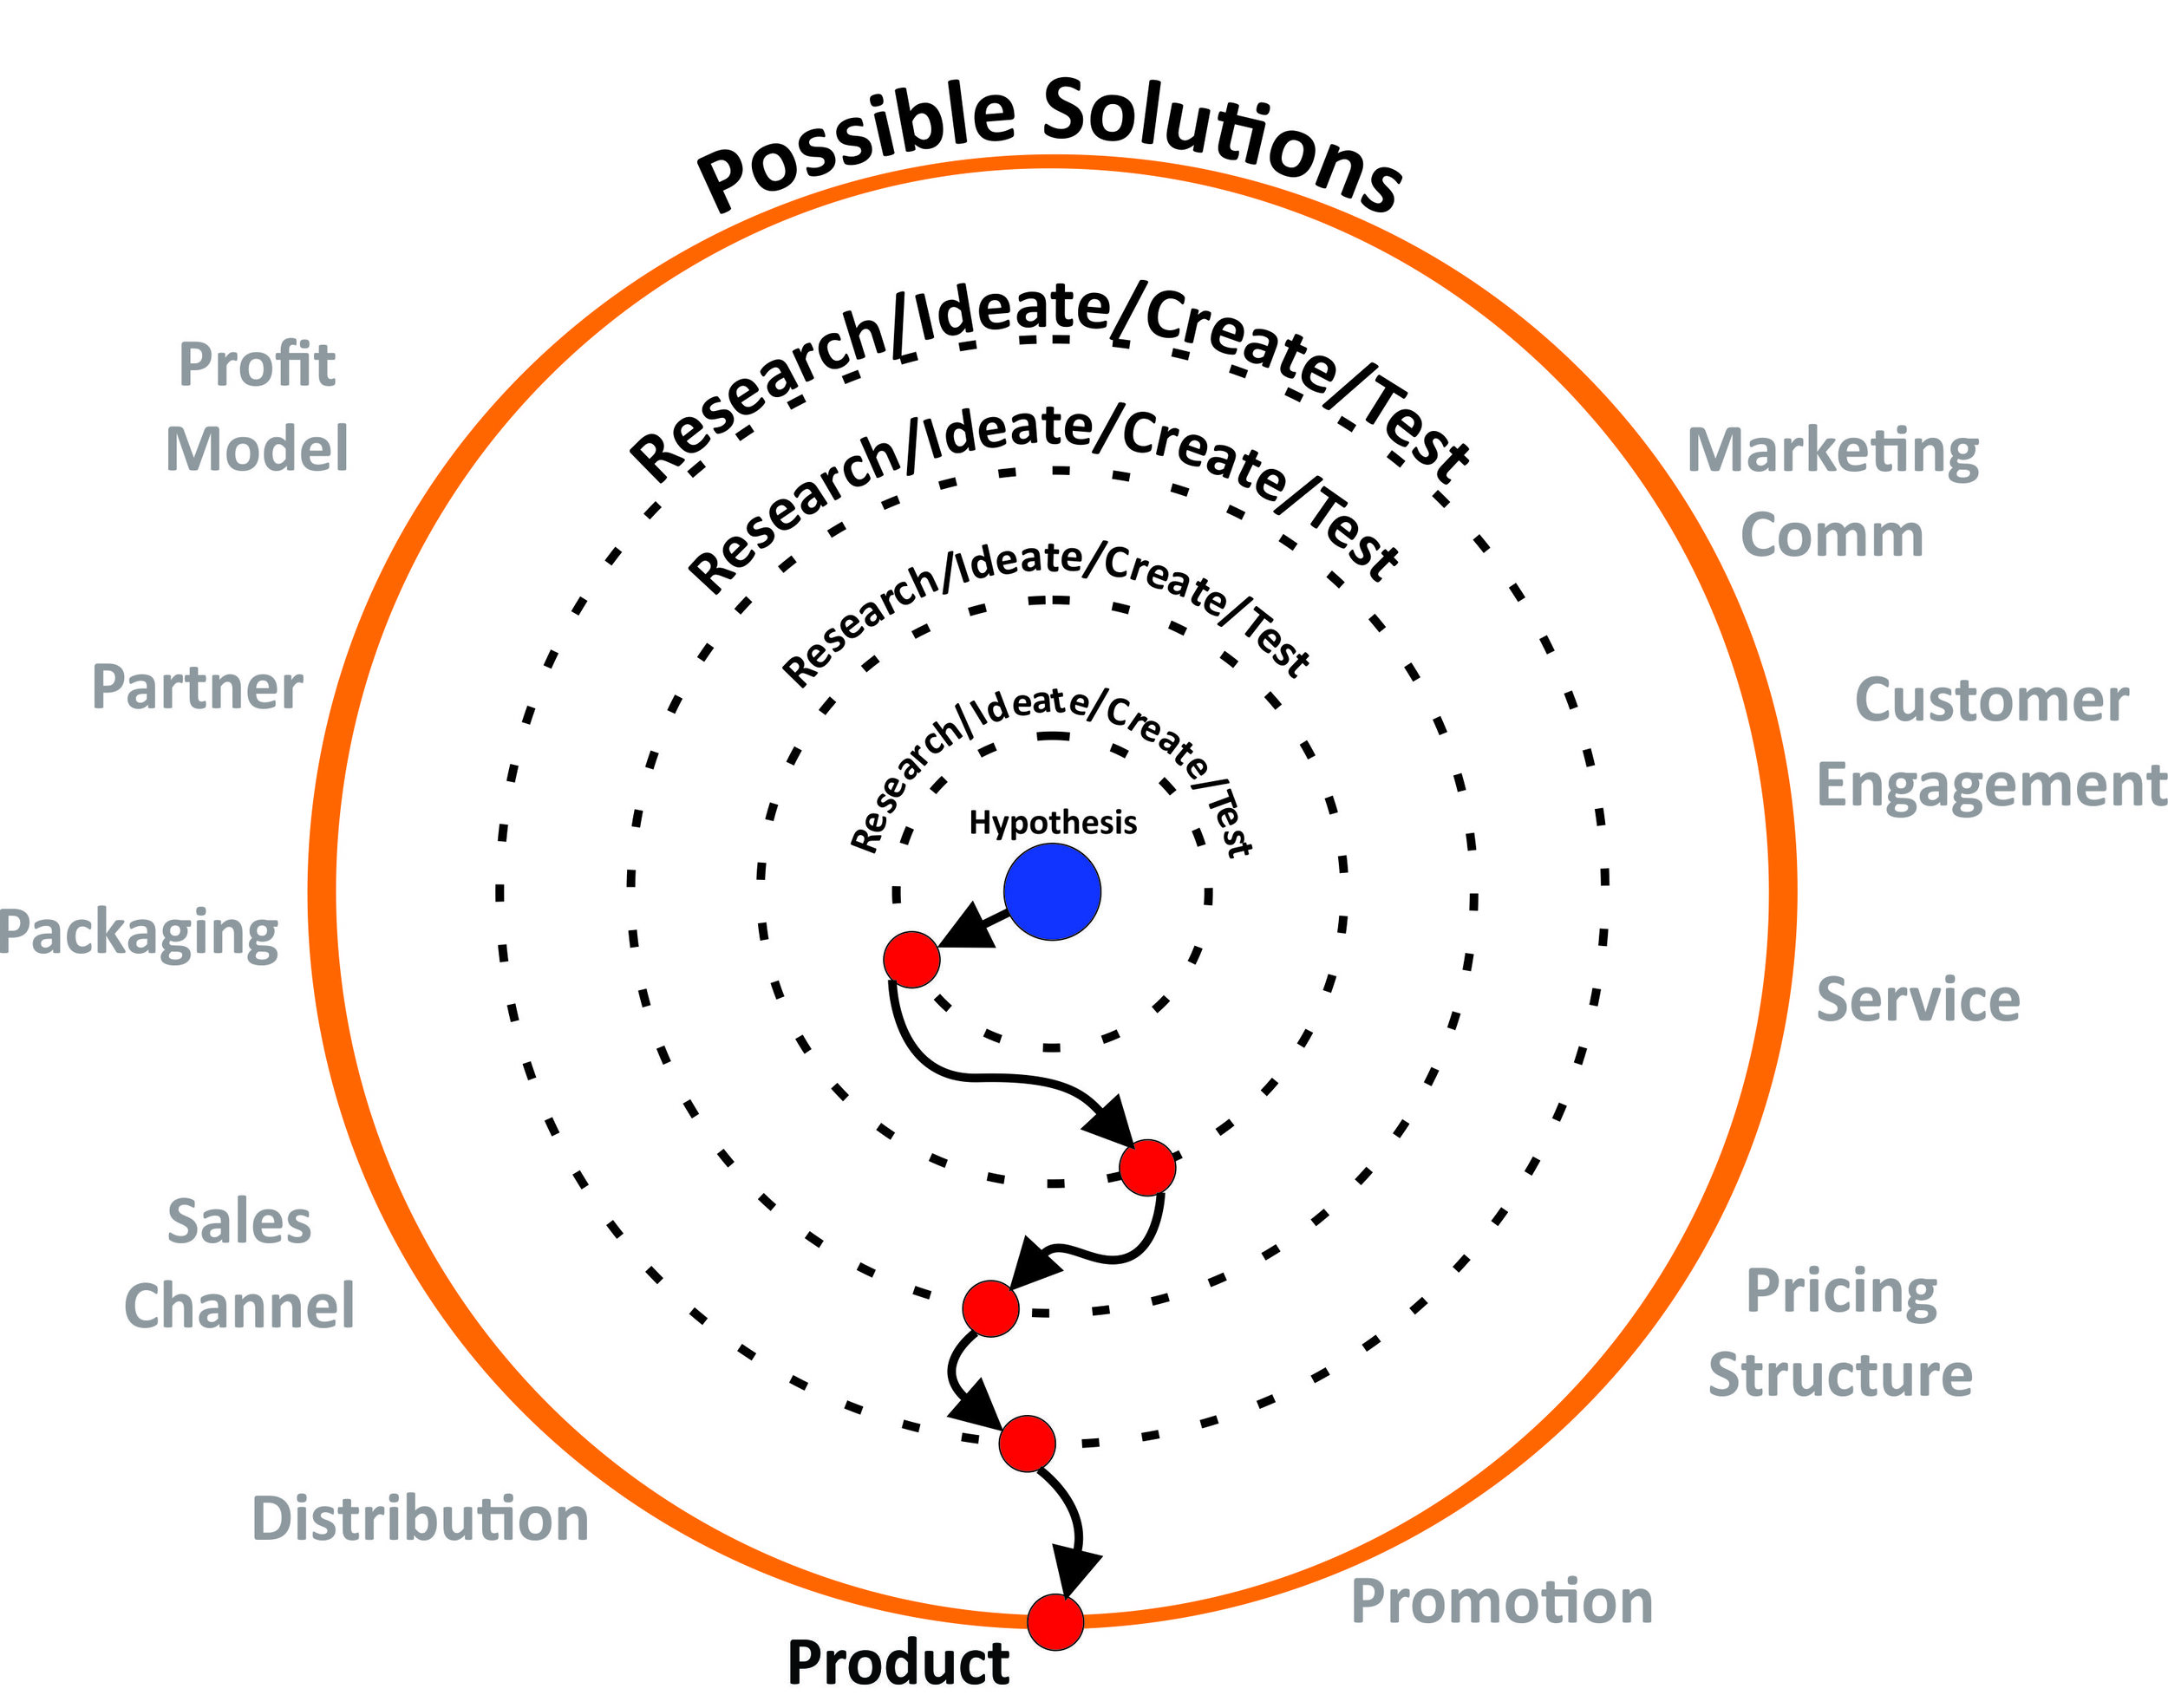
Below is an initial illustration showing the Oort cloud of possible solutions. The solutions are neither exhaustive nor the same for every problem. My choice of potential solutions is purposeful in that all parts of a business model need to be open to change and not merely products and services.

Oort cloud 001.jpg

With a start and end in place, we can then add several layers of the Design Thinking process (Research/Ideate/Create/Test). These layers can be set with durations and end dates to make any project manager happy. A start and finish can be established, without the solutions in clear view. We do have to keep in mind that learning during the process may cause us to have to add orbits as we go, but only if the value of the innovative solutions outweighs the need for a specific end date. The value of a game changer would probably allow for a little more time wouldn’t it? One way to decide the value level of the current solution would be to try my Value Sorting Template at the end of each phase.

Also we should understand the Research/Ideate/Create/Test tasks occur between the “orbits”. At each orbit a course correction will occur and in some cases multiple courses will be branched out. Think of it as a sling shot maneuver around a planet in order to follow a new course(s), which is similar to some Agile development methods.

The below illustration presents this approach.

Oort cloud 002.jpg

Now that we have a non-linear model of a project, we can begin a discussion about how Design Thinking uses failure in an incremental manner. Design Thinking methodology dictates that failing early, often and cheaply is a learning tool to bust assumptions and biases to uncover the correct solution(s).

Design Thinking starts with a hypothesis, based on initial research and knowledge to date. You must start somewhere and quickly test the assumptions that exist with the understanding that through learning, many if not all assumptions will be thrown out in the initial phase. The goal is to stop inertia and get things moving. Speed is the key in this initial phase.

Speed will most likely slow in each additional phase, but not necessarily, as more detailed research and more refined prototypes are used to refine, versus define details within the solutions.

In the below illustration I have visualized this course correction through a project. It is no longer a potential continuous churning of the process seen in the linear illustration above.

Oort cloud 003.jpg

The above has been simplified as a first step to show this new illustration method. It implies, incorrectly, that there is only one solution for the problem. But as we know the solution may actually require several solutions. The below illustration visualizes the process where the Design Thinking methodology will discover and clarify the multiple solutions needed.

Oort cloud 004.jpg

The intended benefits of this new visualization are multiple. One, I hope to clarify the meaning of failure in Design Thinking. Second, I hope to eliminate the fear that Design Thinking is a continuously churning process with no regard to a final solution. Third, I hope to create the understanding that this is a team sport and all members should be involved throughout the entire process. No more throwing things over the wall or departmental domains as the linear illustrations often imply. Last, I hope that the idea of multiple solutions, creating innovative complexity (i.e. Value), illustrates the value of Design Thinking to those who still don’t understand it.